
Grain Market Overview September 1
September 1, 2016Grain Market Overview Sept 7
September 7, 2016Commodity Market News Sept 7

Summary
Companies like Autonomous Tractor Corporation (ATC) have been experimenting with the technology around autonomous farming tractors by 2102 or even earlier. Case IH (CIH) recently reinserted itself into the headlines when it unveiled its Autonomous Concept Tractor. Bringing land, seed, fertilizer, chemicals, equipment and man-power to optimal use in what Case IH (CIH) is calling ‘High-Efficiency Farming’. The Autonomous Concept Tractor proposes to enable producers to remotely operate and monitor your equipment by way of a portable tablet. They suggest being able to just select a vehicle and sending it to the field. Using real-time views with onboard cameras you will be able to direct the equipment around the farm. Additionally, system software would be able to plot the most efficient infield paths. Working within tighter weather windows would be much easier and working around the clock if necessary would not be as strenuous. It might still be a long ways off before reality works as well as the concept. Generally speaking, producers are not yet really receptive to the ‘Autonomous Tractor’ from the feedback that we have seen. Where Case IH and the like might be missing the mark is believing that ‘technology’ is what makes the difference. We believe otherwise, it is always the farmer that makes the ultimate difference.
Also in the news, last week on Wednesday the Brazilian Senate voted 61 to 20 to convict Ms. Rousseff on charges of manipulating the federal budget in an effort to conceal the nation’s ever growing economic debt problems. The impeachment vote of the suspended Dilma Rousseff, the nation’s first female president, cleared the way to remove her from office for the balance of her term. Brazil and South America continues to struggle economically. For Brazil they are looking to move forward under new leadership.
As the US growing season is winding down some attention may shift to the South American 2016-2017 crop production potential. In Argentina, Corn planting should begin by the end of September and the Soybean planting season typically kicks off in October. Argentine President Macri made a number of campaign promises when he took the oath of office in December. Some of the policy directives that he intended to implement included eliminating the export tax on Corn and Wheat and the 5% reduction of the Soybean export tax. During his tenure he also was responsible for a 40% devaluation of the nation’s currency. Domestic farmers were also very much excited about his pledge that “government would no longer interfere with the export market”. Fast forward 8½ months and we find that domestic Corn price has nearly doubled leading to increased confidence in the viability of Argentina’s Corn production. A drawback that has been felt is soaring inflation that is upwards of 40%. The deflated currency matched up with massive inflation is a challenging combination that has made importing needed inputs very expensive. General consensus is that farmers are encouraged given their situation prior to President Macri. The 2016-2017 Argentine Corn acreage is expected to increase 25% from the 2015-2016 crop. The Soybean 2016-2017 crop is expected to see a 3% reduction from the previous year.
The USDA has Corn and Soybean production numbers at 175.1 Bushels per Acre (BPA) and 48.9 BPA respectively. Production is slated at 15.2 Billion Bushels (BB) for Corn and 4.06 BB for Soybean. Soybean hitting the 4 BB production level is looking more and more probable. Researchers and analysts are raising their estimates as well. Given this backdrop we want to suggest that investors exercise caution when the markets rally. The rallies may find difficulty in sustaining their levels. As would be expected Money Managers have backed off of looking for higher prices. Speculative Net Short Corn contracts saw an increase of 16,003 contracts (up 10.1%) from the previous CFTC report. Net Long Soybean contracts fell 17.79% or 20,182 contracts from the previous week. Net Short Soft Red Winter Wheat and Hard Red Wheat also recorded position increases.
The lows that were made last week can hold up for one of three variants: (1) 2-3 trading days, (2) 5-7 trading days or (3) 8-13 trading days. We believe that variant (2) is most probable given the shortened trading week because of the Labor Day holiday.
Corn
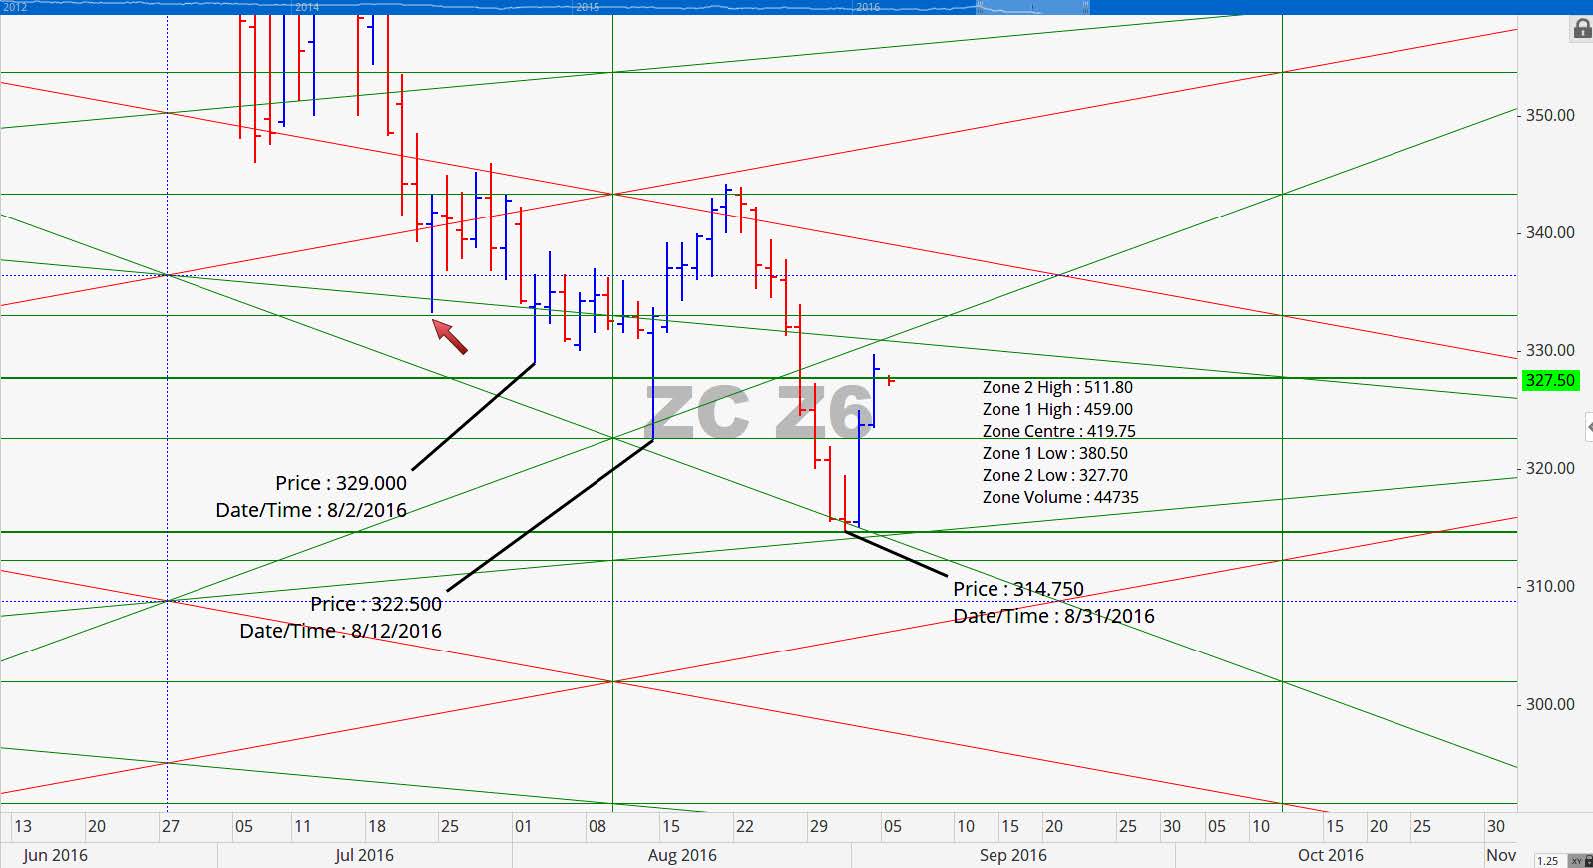
Wednesday of last week marked the 8th trading day and the 7th seller’s bar from the August 19th high. The two dramatic advanced that were posted on Thursday and Friday were enough to land Corn futures in positive territory for the week. December Corn was up 3.50 cents or 1.08% and the March contract was up 4 cents or 1.20%. Two day up by no means is conformation of a trend reversal but the pause in the downtrend was timely. We had been looking for a low to come in at the end of August or in early September and significant move to occur off of the August low was rather impressive. The Corn harvest is on track to begin this week and expectations for a record harvest are unchanged. The question at hand is how close to the harvest low was last week’s low. Fundamentally, Corn should have trouble getting past the August 19th high. Our expectation would be that Corn enters into a low to mild volatility beginning this week where it declines into the middle to late October. We believe that 300 should hold through the remainder of the December futures contract.
December 2016 Corn Charts
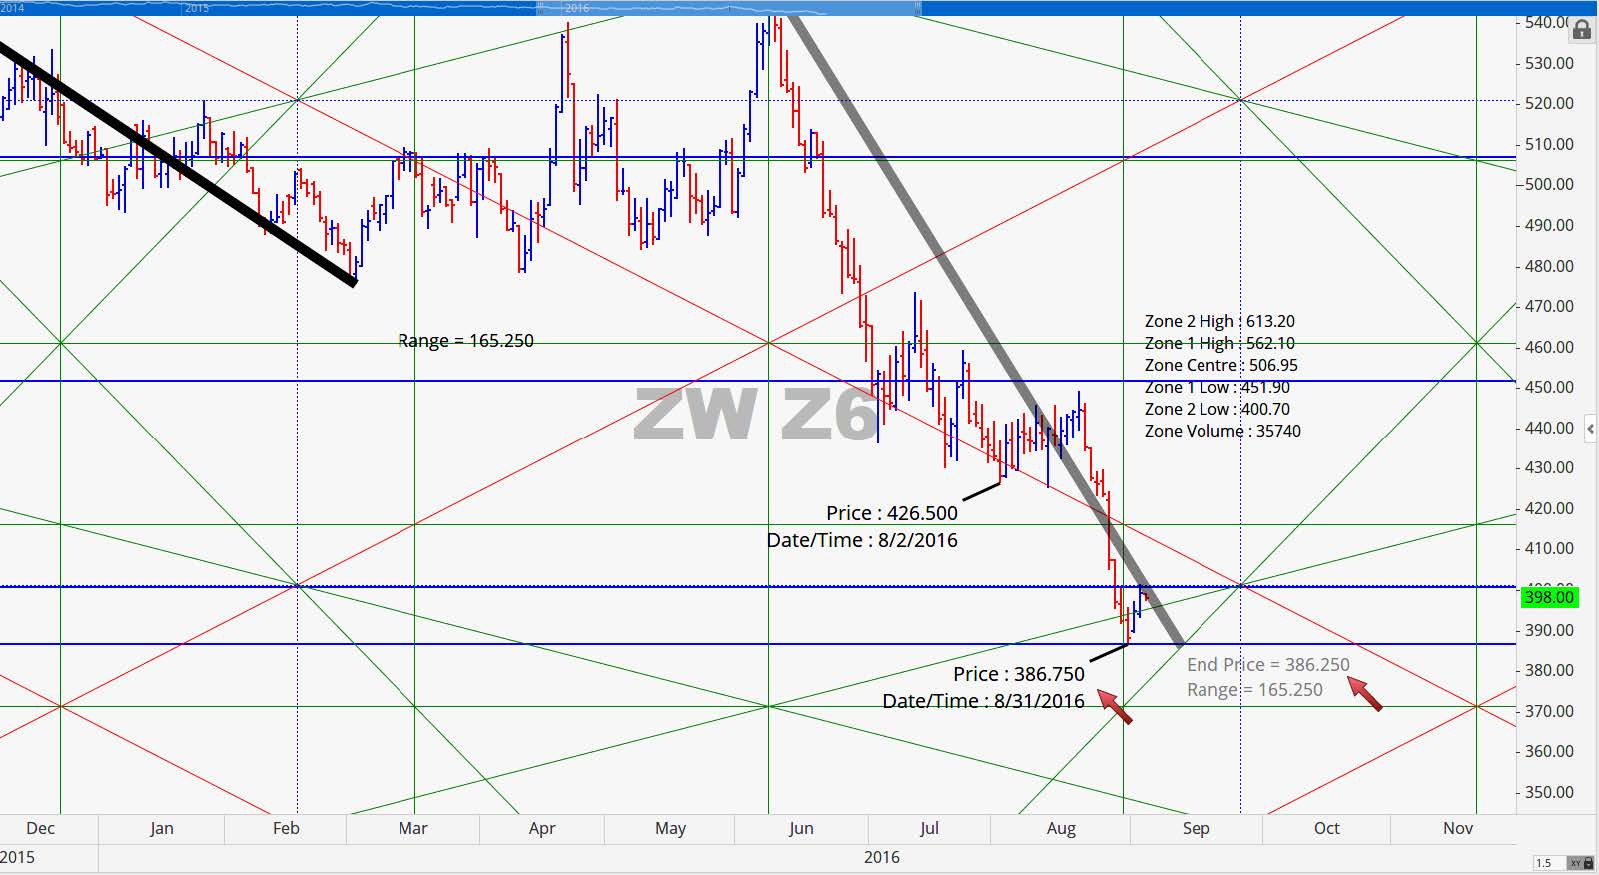
December Corn moved down to our natural support line in conjunction with our ‘Make or Break’ level. That low was at 314.75. From there price advanced to resistance at 329 and that is where it has struggles some today. Since price was not able to get below 311 reaching 294 is off the table for us. In fact there is a good chance that the contract low may not breach 300. The move to the upside was right on time. We previously shared with you that we were looking for a potential change in trend when the price action reached our purple box region in the chart. Both time and price came together to change the trend. The three key levels for this contract for now are 311, 329 and 347.50.
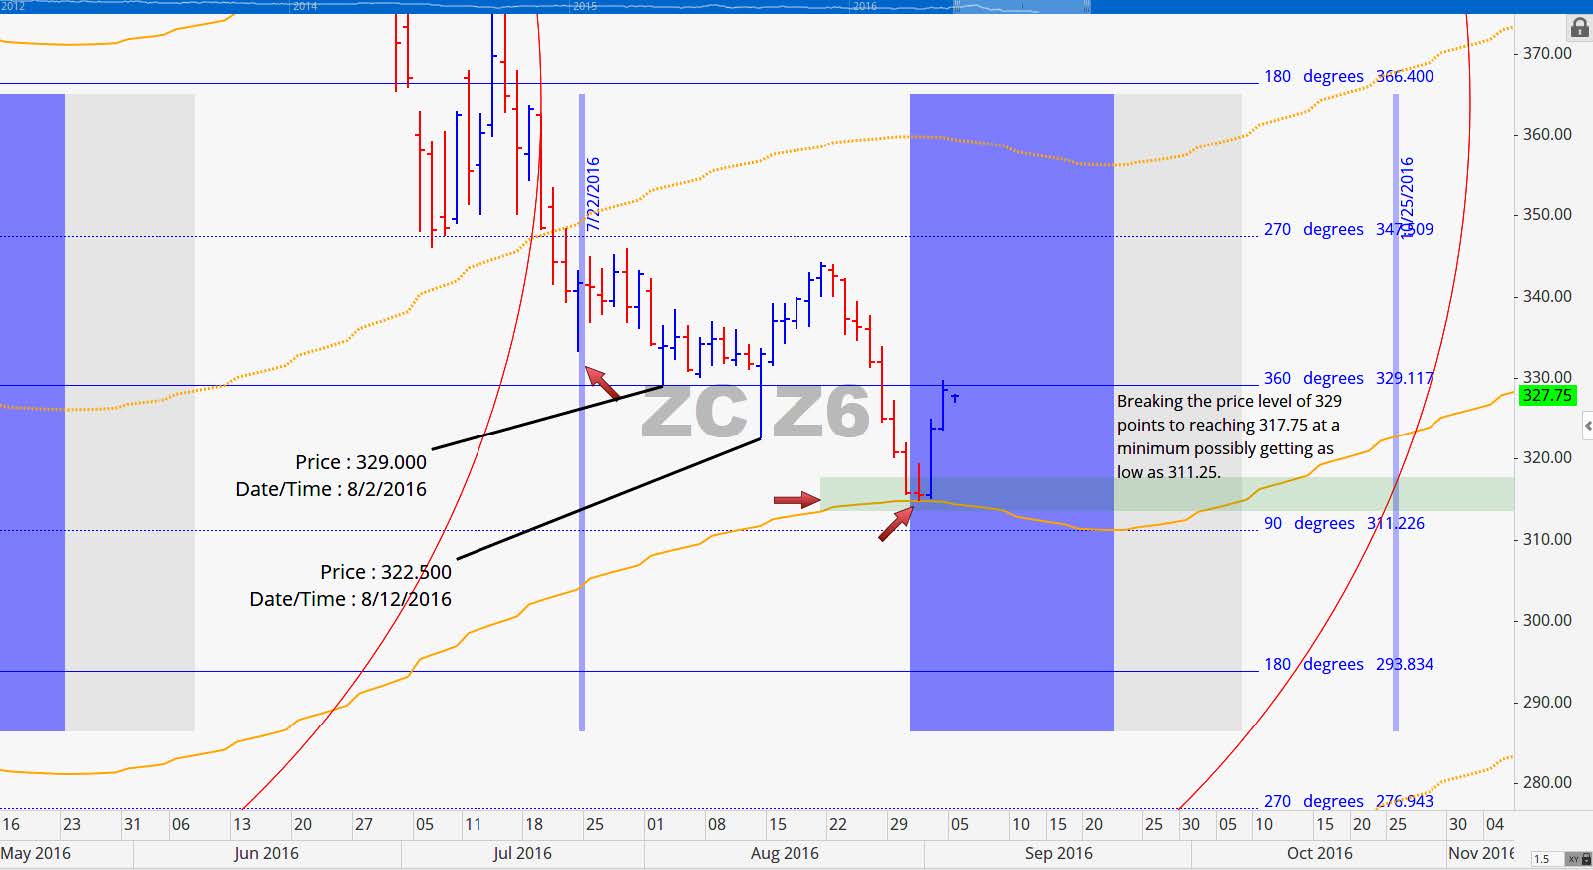
Two levels below the point of control has shifted from 330.25 to 327.75. This is the area that price is currently battling today. That level is obviously close to our 329. For many of our clients that went long near the 318-320 price level we had a minimum price objective of 329. Upon reaching 329 we also suggested moving stops to an area above their entry. Some have either taken off either part or all of their position. The move up to 329 happened a little faster than anticipated.
March 2017 Corn Charts
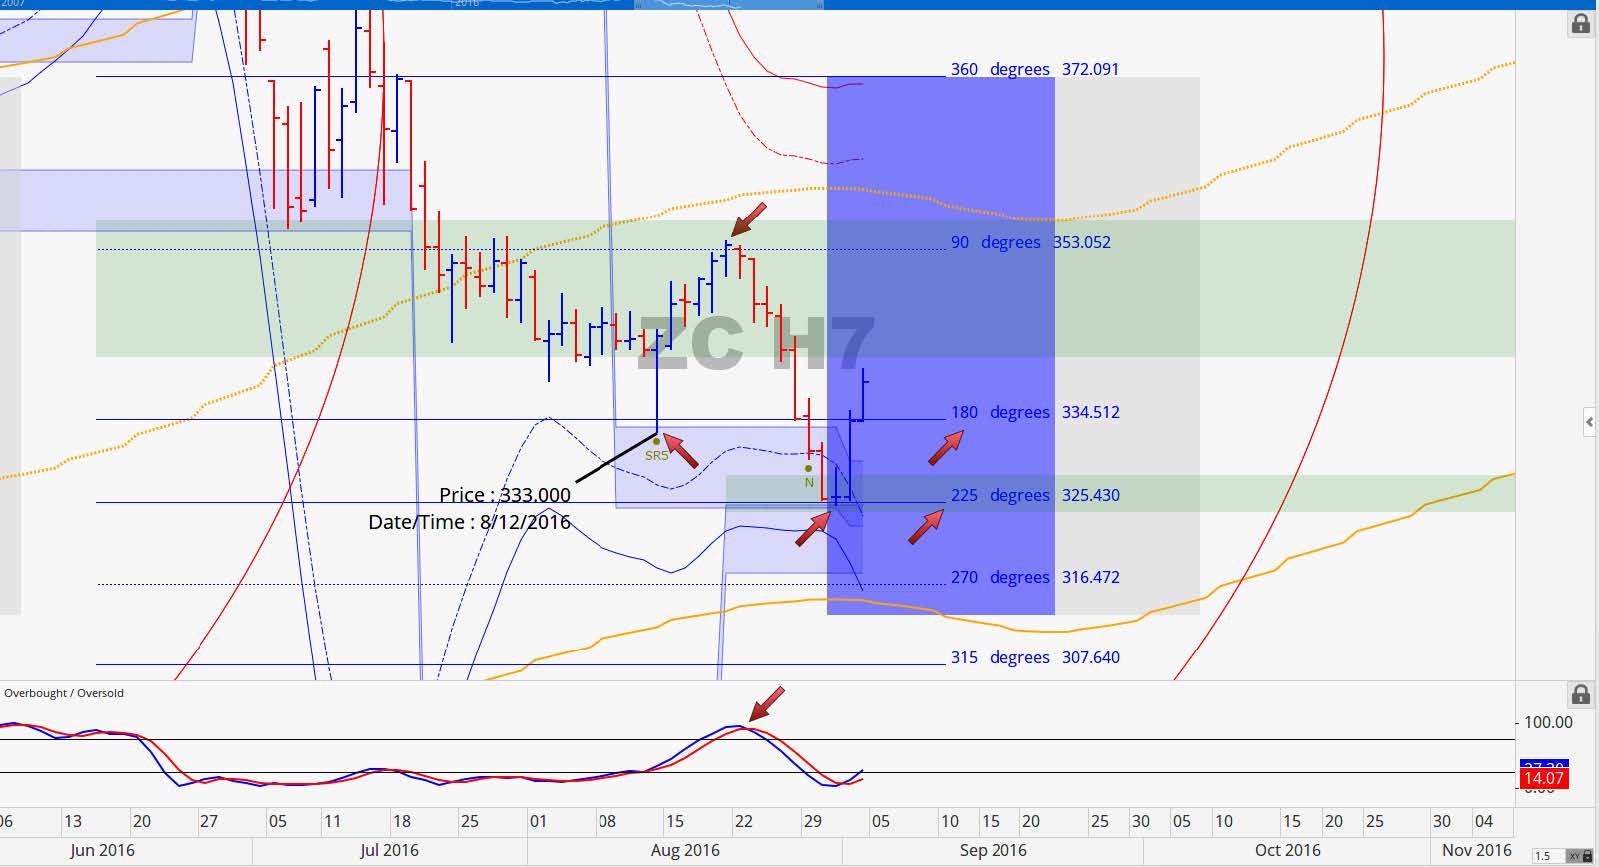
When our volatility based support zone overlap we can expect strong price support or resistance near those areas and that is exactly what occurred last week. A shown in the chart by the arrow at the low, price came a halt very close to 325.50. Last week we shared that 325.50 was a key level and you would have known in advance to look for support there. We also shared that price was close to being oversold. It reached oversold last week crossed on the way back up and proved to be a very nice move to the upside. We got the corrective bounce that we were looking for. The next key resistance level (not shown in the chart) is 343.75.
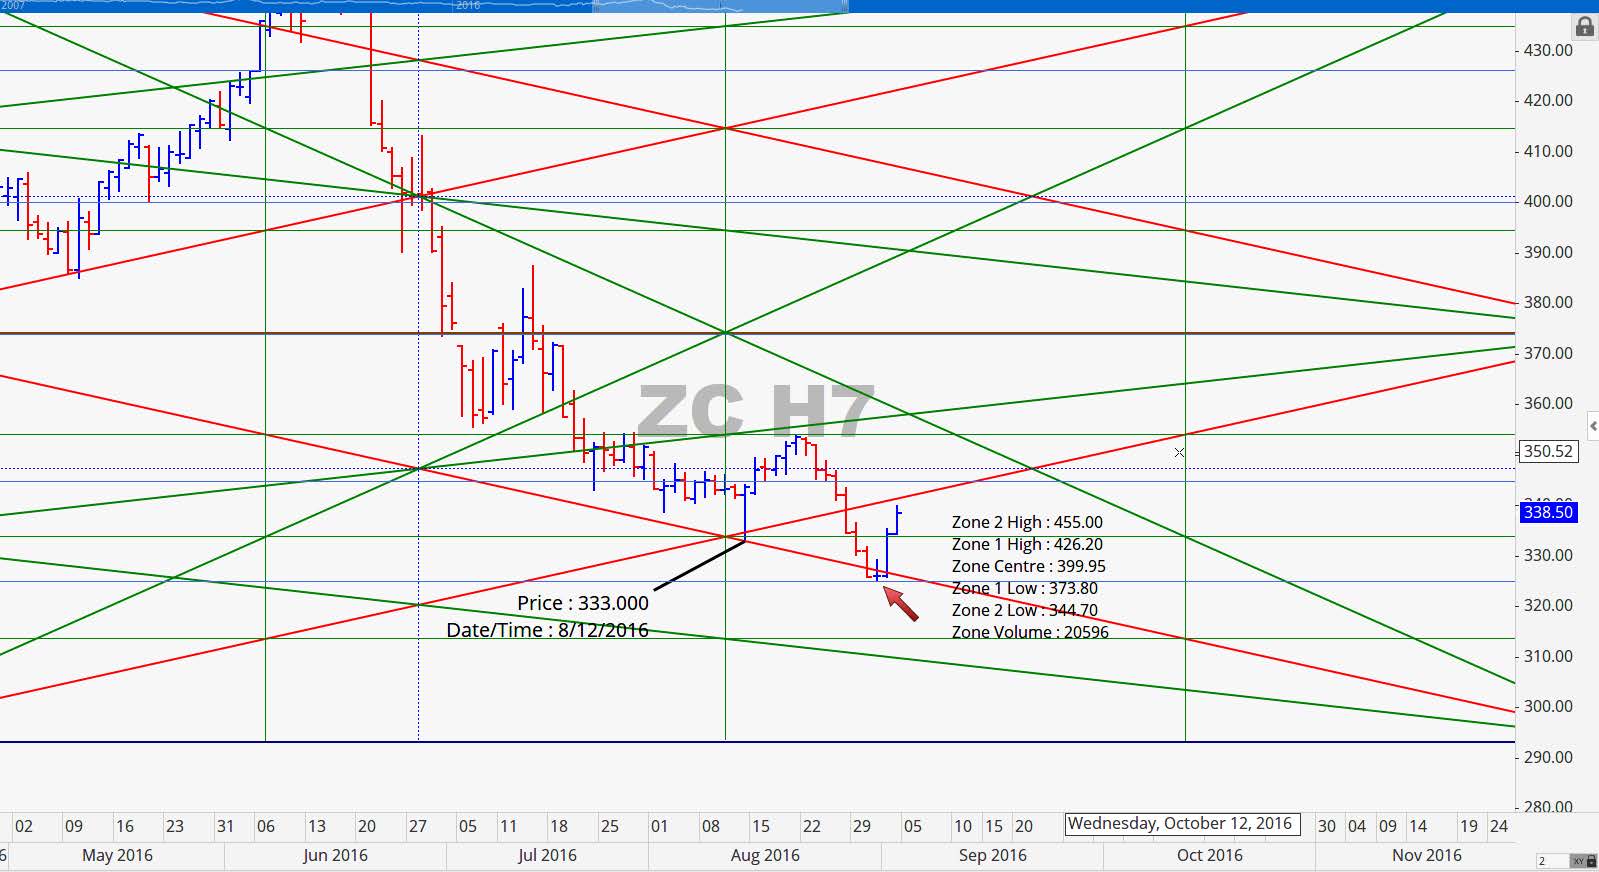
This next chart really does speak for itself. We warned last week that that the red diagonal line (a scaled 1x1 price per day timing line) is often one of the most important angles to follow. As would be the case, price came down into our angle and turned back up in neck breaking fashion. The experienced trader could have even faded a long at this level with a 2-3 cent stop. Very close to the 343.75 level above to standard deviations below the point of control is 344.75.
Soybeans
The Soybean harvest starting is only a few weeks away and there will probably be very little to change the fundamental narrative at this point. One of the looming problems for producers that has not really been addressed very much is the problem of storage. If you still have some on-farm storage from last year’s crop this current crop will probably fill up what space is available very quickly.
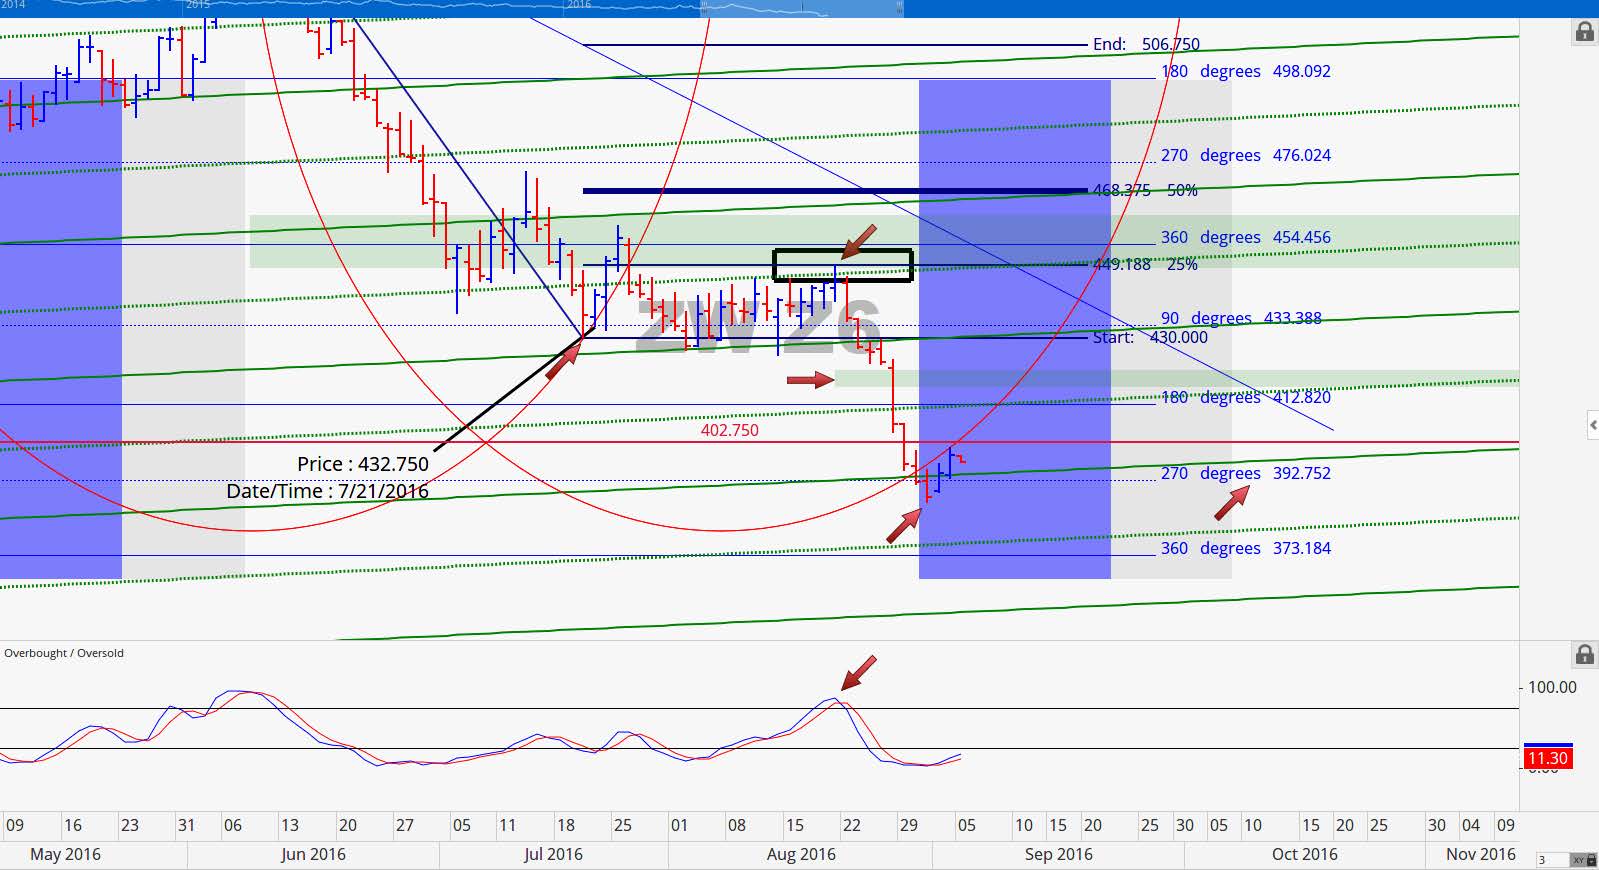
One of the cycle moves that is fairly consistent is a Soybean harvest low that hits close to the 1st week of October. Now just because it has happened in the past does not mean that it is guaranteed to happen again especially if a number of outfits are all looking at the same timeline. What we want to do is analyze the market price action as we approach potential timing windows and read what the price action is suggesting. Last week, November Beans were down 14.75 (1.52%) but finished the week in a stronger position. January Beans lost 14.0 (1.44%). We are still looking for a decline that runs into early to mid-October. A sideways to slightly up move this week would not come as a surprise.
November 2016 Soybean Charts
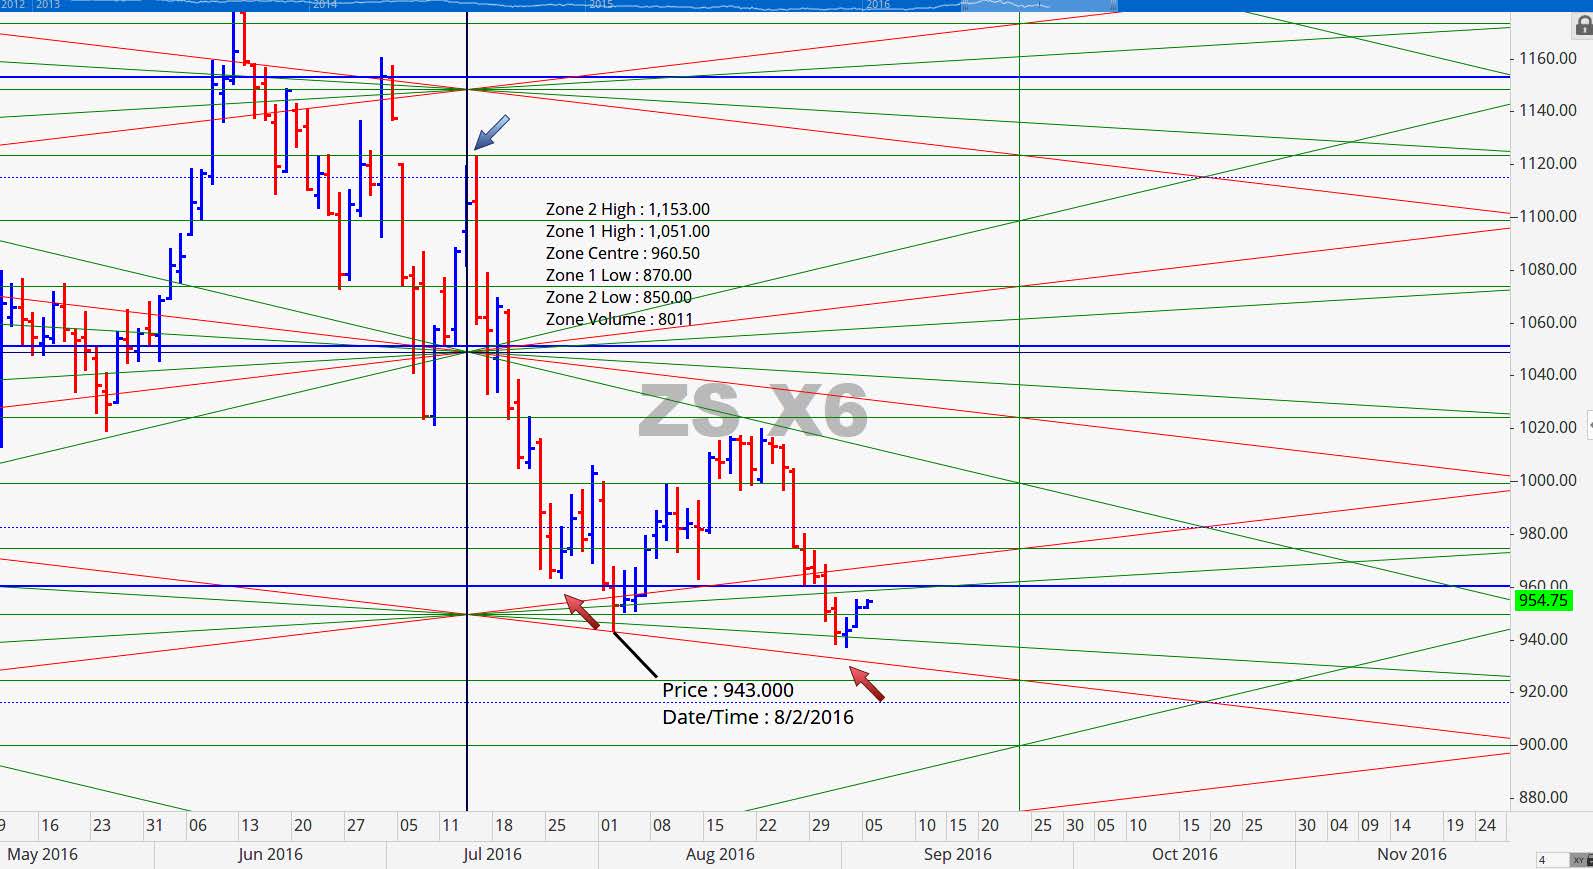
Beans did not make it to our 928 minimum price objective as of yet. It got to 937 breaking the August 2nd low but time will tell if it will return back down. It is important to note that what it took 14 trading days to gain it surrendered all of in half that time. September 8th is an important timing widow for this contract so it is possible that we move up into this date for a top then move back down. If we are at resistance near the 8th be on watch for a possible shorting opportunity. We have key levels at 990, 958.75 and 928.
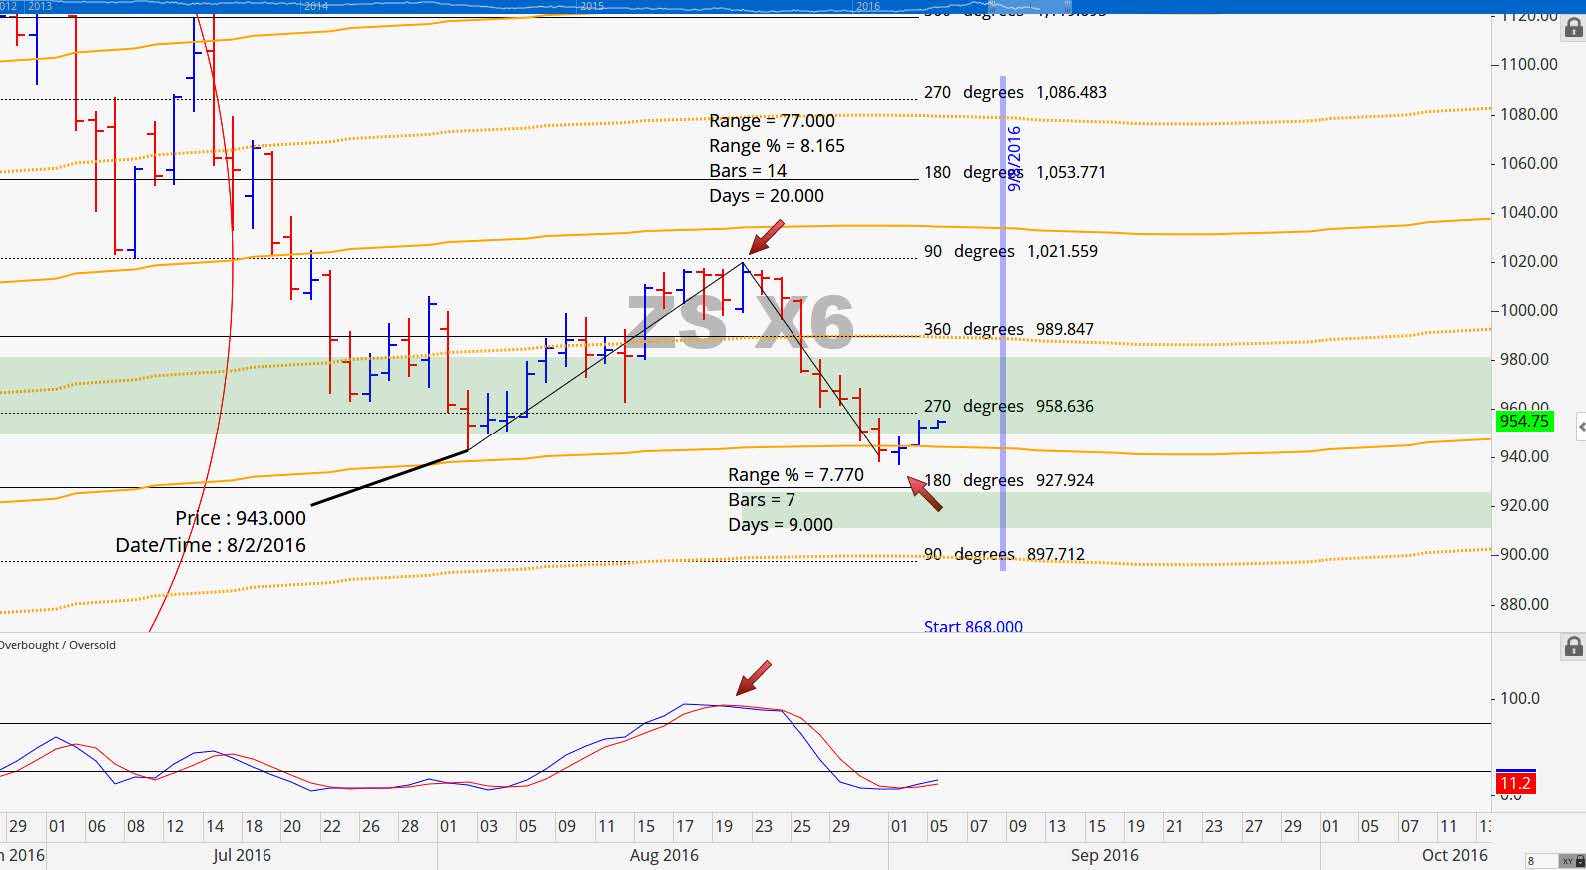
Once again our markets are respecting our 1x1 angle. In the chart below price came very close to hitting it but turned up from there just as it did on August 2nd. The point of control of control (960.50) for this contract has been reasonable resistance today in early trading. Above this level a move to 990 is possible. We are predisposed to shorts instead of longs for this commodity because Managed Money really needs to lull buyers in so that they can dump off to them.
January 2016 Soybean Charts
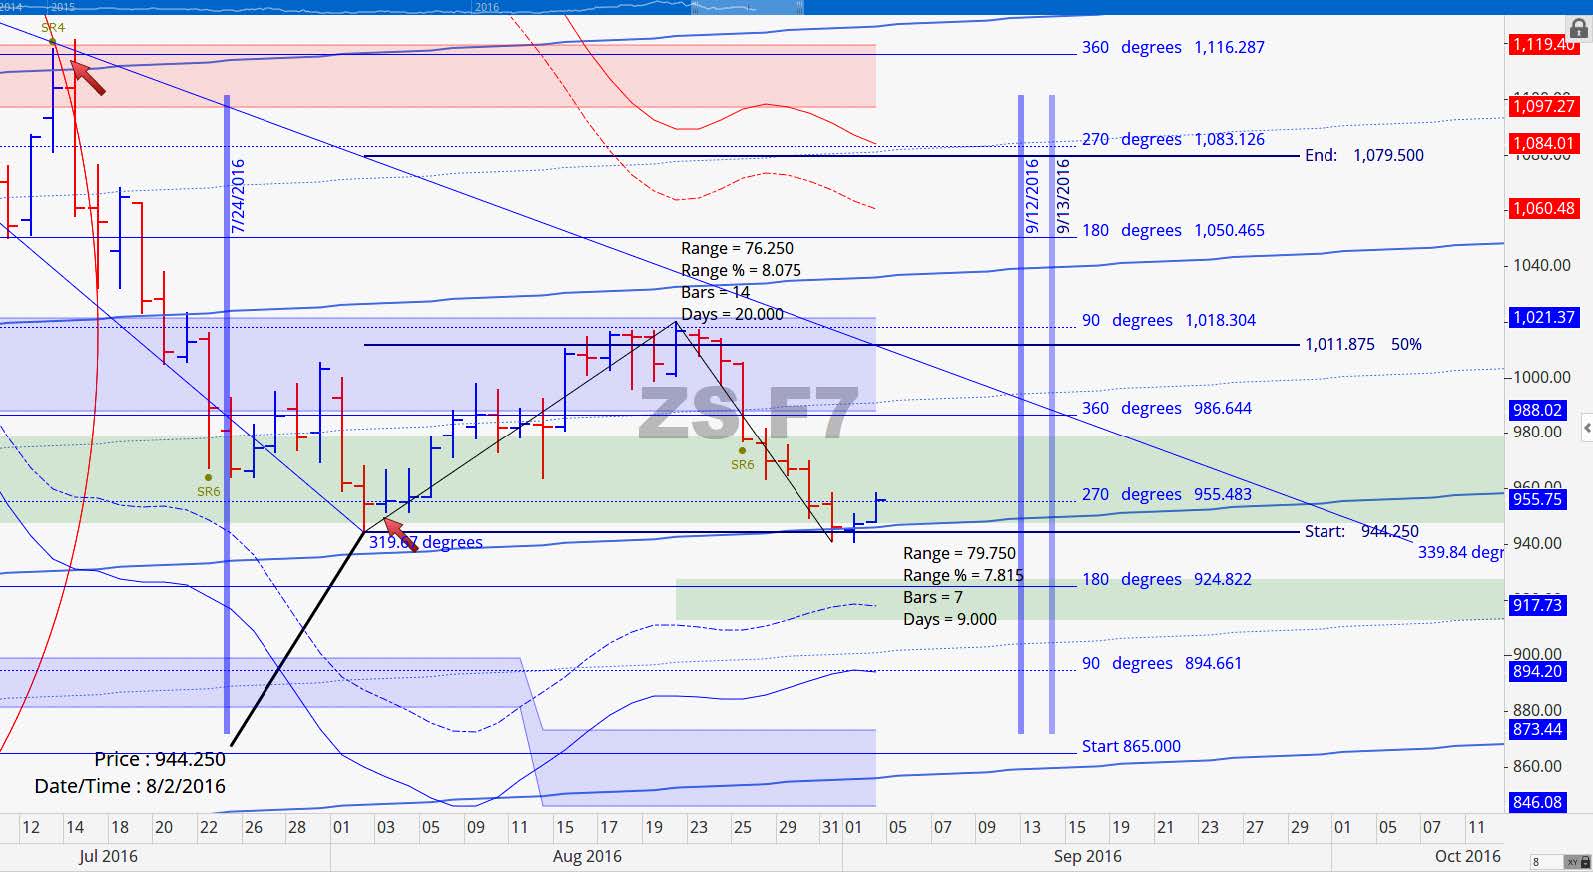
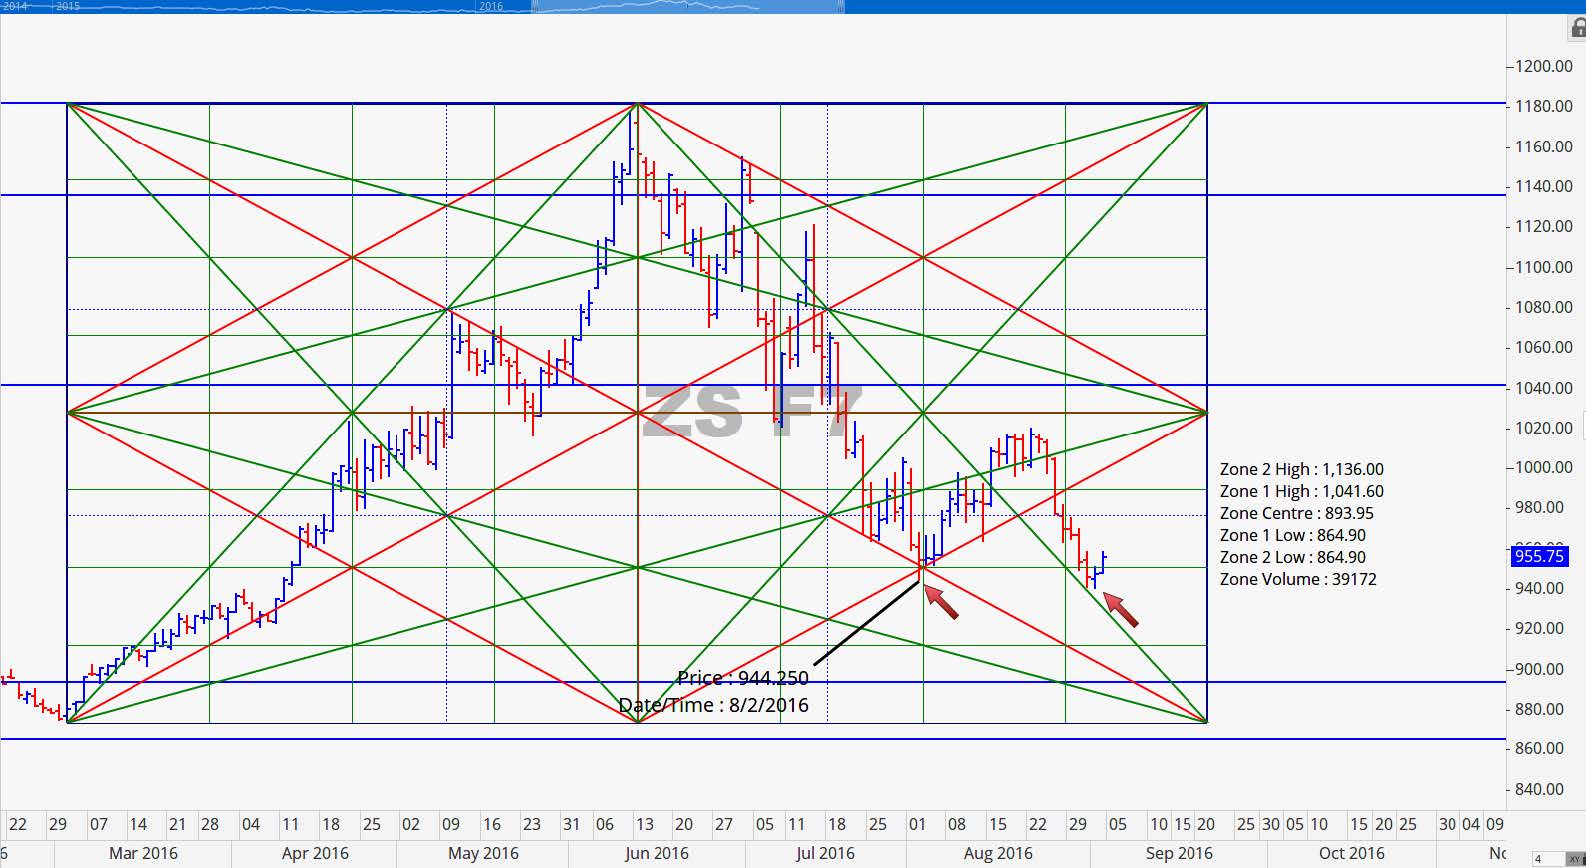
The January Beans contract tested the previous low of 944.25 when it got to 940.25 last week. Clearly there were some limit orders there. Also, that is an obvious spot to trap rookie traders that are trying to catch a ‘breakout’ trade. Once the previous low was broken they went short. They felt really good for about 3-4 cents and have been in denial ever since. Once the pain is too great they will tap out and the move to the downside will resume but not until they have given all of their money to smart money. Overhead we have resistance at 986.75 and we still like the target of 925 below. Between September 12-13, we have the potential for a turn in this contract.
Wheat
If it was ever in doubt who or what controls market movement – more and more industry consolidation is putting control squarely in the hands of Managed Money. The most recent CFTC COT report revealed that a whopping 43.7% of all short Wheat positions are held by Managed Money. With fewer layman market participants we will often see volume come in and out of the markets at the most unusual times. One of the ways that this shows itself is when we have big moves in the overnight session that has little to zero follow through. Another way is when trading volume is primarily the result of ‘program trading’ and there are a number of key program trade levels that trigger massive volume at price trades.
The caveat to this massive short position is that when Managed Money begins to unwind its positions, huge short-covering rallies are very much in play. Since market participants are lacking they have to lull unsuspecting speculative traders into taking the other side of their positions. December Wheat ended the week pretty strong but not strong enough to close positive on the week. It lost 8.25 cents or 2.02%. Wheat may have put in its final low of the year and may surprise many to the upside. It could get weighed down by Corn and Soybeans in October but once it gets some legs it should really go.
Grain Market Overview October 11
Read more