
Grain Market Overview Sept 21
September 21, 2016Grain Market Overview Sept 28
September 28, 2016Commodity Market News Sept 26

Summary
The latter part of the week has drier weather ahead according to the Nation Weather Service for the Midwest which should better facilitate producers taking their combines into the fields. There was lots of rain over the weekend. In Iowa and in Wisconsin swelling rivers and creeks have prompted officials to issue evacuation and curfew orders ahead of the potential for flooding but so far it has been the early results of the Soybean harvest that have held futures prices in check.
The CFTC's COT report suggests that Managed Money is leaning a bit more bearish on Corn and perhaps not as bearish on Beans. The Speculative net short Corn contract positon moved up just shy of 4500 contracts to 156,033 for the week ending September 20th. The Speculative net long Soybean position increased 13,896 contracts to 86,782. It is natural to believe that investors were taking the wetness over the last 2 months into consideration when it comes to the increased Bean long stance. Although, indications from harvesting suggests that the yields will still be strong and that Speculators may find themselves on the wrong end of that position.
One of the topics that made its way to the newswires last week was the change of policy that Egypt made regarding its zero ergot tolerance. In lieu of their position, the international community essentially boycotted all tenders with Egypt. After three tenders that resulted in zero offers, Egypt realized that they were not in a position to win this fight. Previous transactions between Egypt and other nations had resulted in rejected shipments. The new policy is now in line with the international community at 5% tolerance.
While Brazil is waiting for harvest to get rolling in the southern part of the country, they have been importing increased amounts of Wheat from both the US and Canada. Over the past 2-3 weeks we have seen Wheat futures hold up reasonably well inside of a range bound consolidation. Last month the US reported a 60% increase in the amount Wheat that Brazil imported versus last year at the same time. For the month of September projections suggest that Brazil may import as much as 200k tons.
Wheat, Corn and Soybean futures are all under pressure in trading today but after the dust settled on Friday there was little change in the weekly settlement prices. December Corn finished the week down ½ cent and March Corn was off by 1 cent. November Beans lost 11 cents but that was only a 1.14% change. The January contract lost 13 cents. December Wheat lost 1.50 cents. The USDA's Quarterly Grain Stocks report is scheduled for this Friday, September 30th. A clearer picture of the ending stocks could very well lead to increased directional momentum but ahead of that report the cyclical market pivot window of September 20-22nd that we shared with you well in advance seems to be holding its own quite well.
December 2016 Corn Charts
The Corn harvest is back on schedule reporting in at 9% complete according the USDA. Even though it is on schedule right now it is reasonable to expect some fall backs given the anticipated harvest size. The more Corn that is available to be harvested the more time it will take to gather it all up. The lower double top resistance level of 343.25 held up like a charm. The high came in on September 20th and the first seller's bar triggered on the 22nd. Today we are looking at a weak day and if the market closes at or near the day's low we would expect continued downside follow through going into Friday's report. A close below 325.50 this week would suggest a minimum price objective of 311.25 by mid to late October.
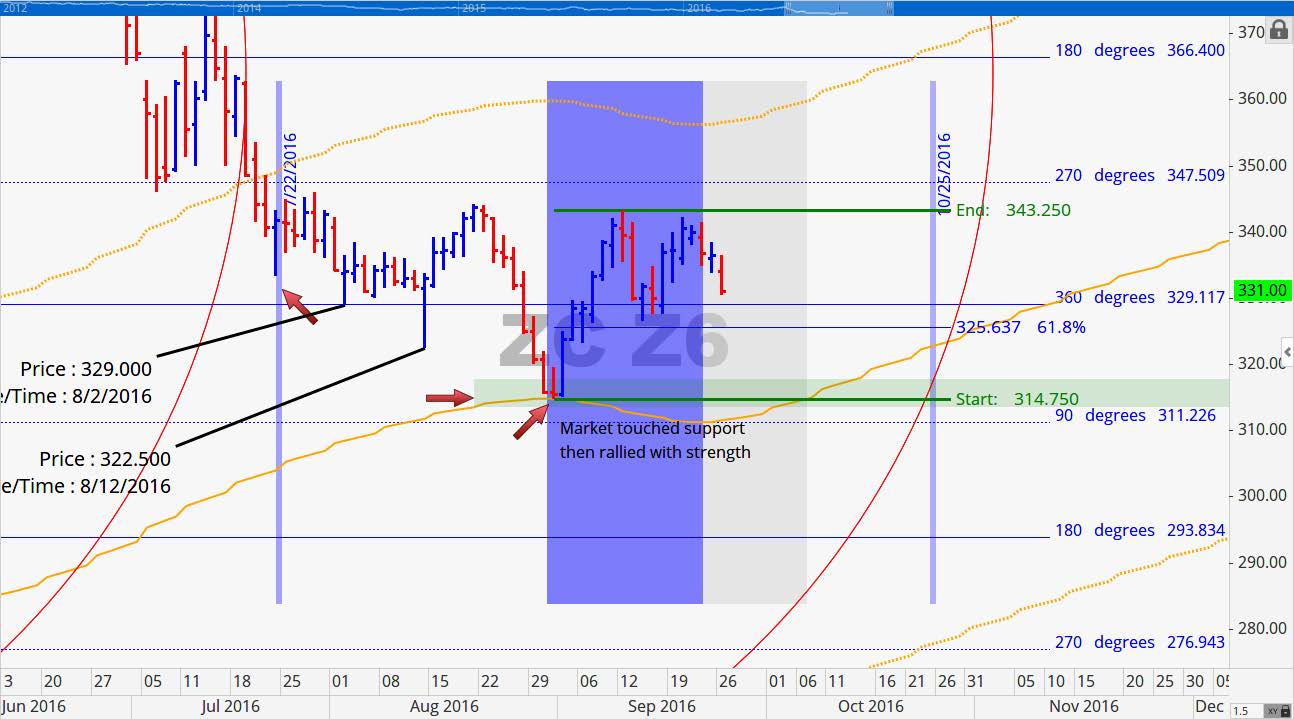
In last week's report we highlighted September 20th as a potential important turning date and that is exactly what we got. This week, our point of control levels are at 379 and 327.50. Once again price finds itself near the 327 to 329 range and we are looking for continued weakness below and potential price stability above. We are about 4 weeks away from our Corn cycle projections for prices to finally stop drifting down. As we draw close to that timeline we will also face high potential projections for a low to come in.
March 2016 Corn Charts
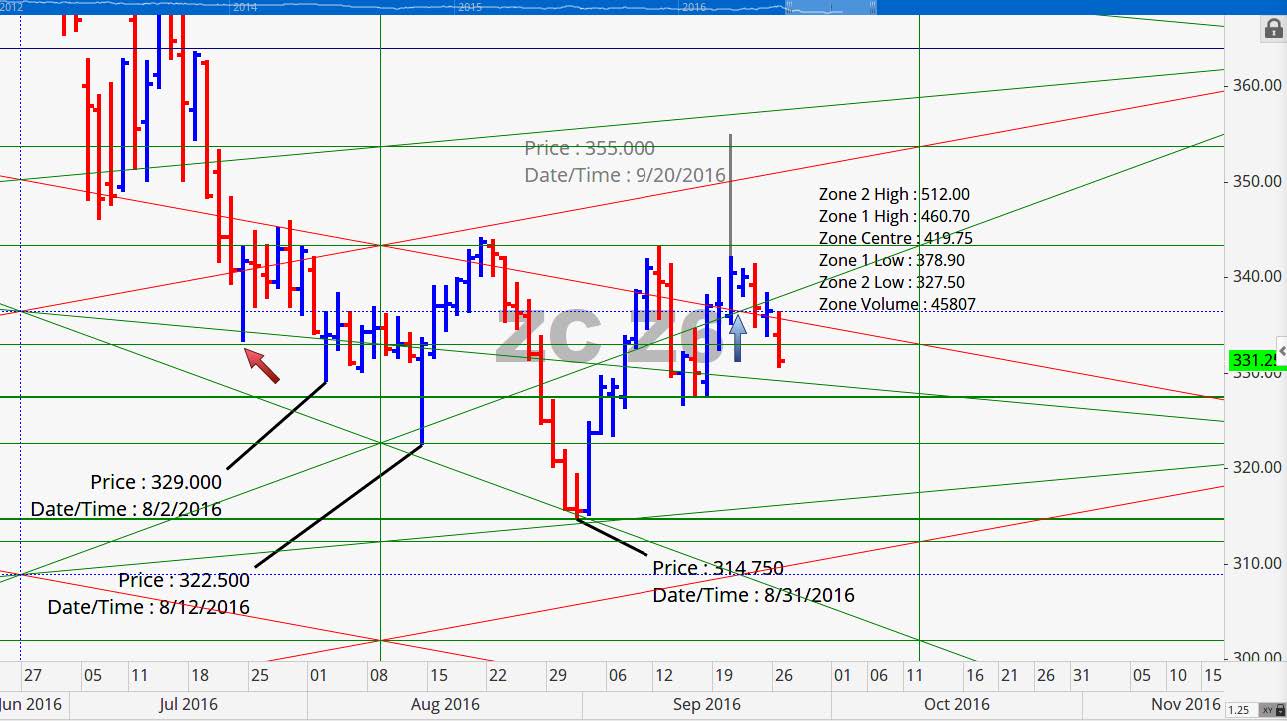
On this chart we were looking for a boost in price action energy around September 22nd. That ended up being the biggest down day in about a week. We anticipate that there will be a number of sell stop orders sitting near the 336.50 (a break of the September 14 low). The CFTC COT report shows that Managed Money may be increasing their short side bets so a break of that level could make for an accelerated moved down to either 325 or even 318. At either of those levels do not be surprised by some short covering. Key resistance is at 353 held up very well as would be expected. The next level of potential downside support is 334.50.

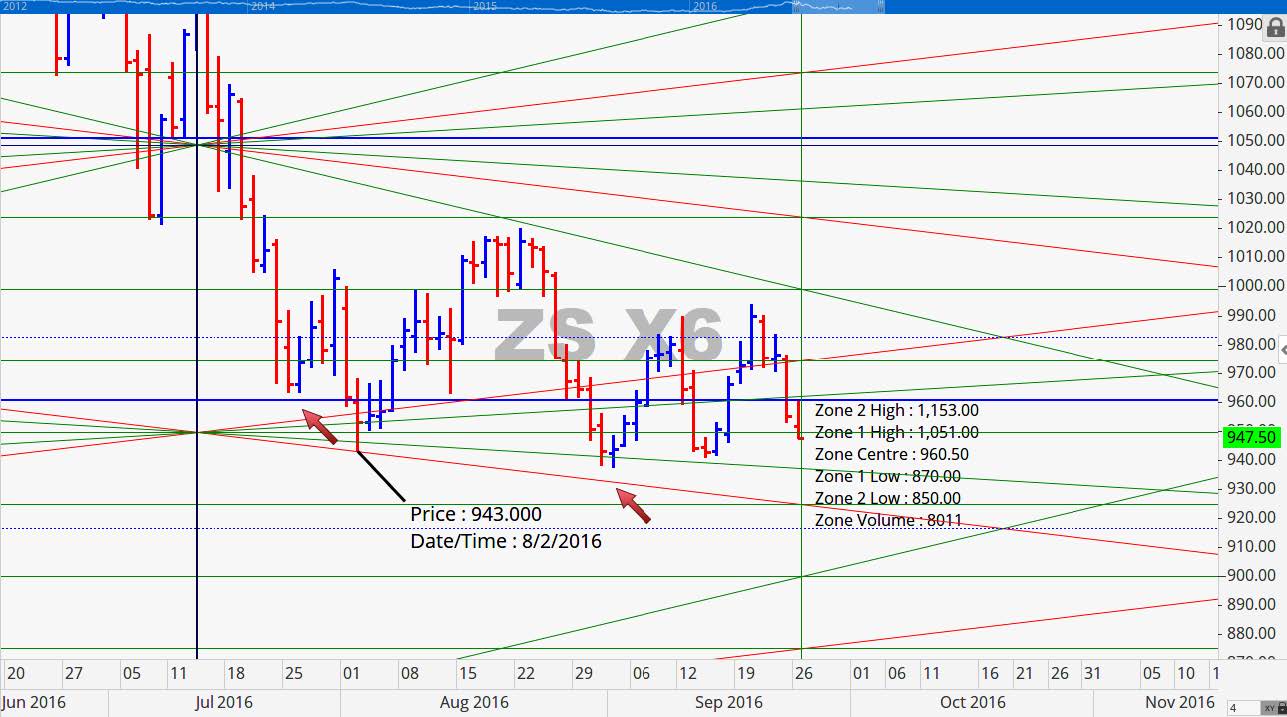
November 2016 Soybean Charts
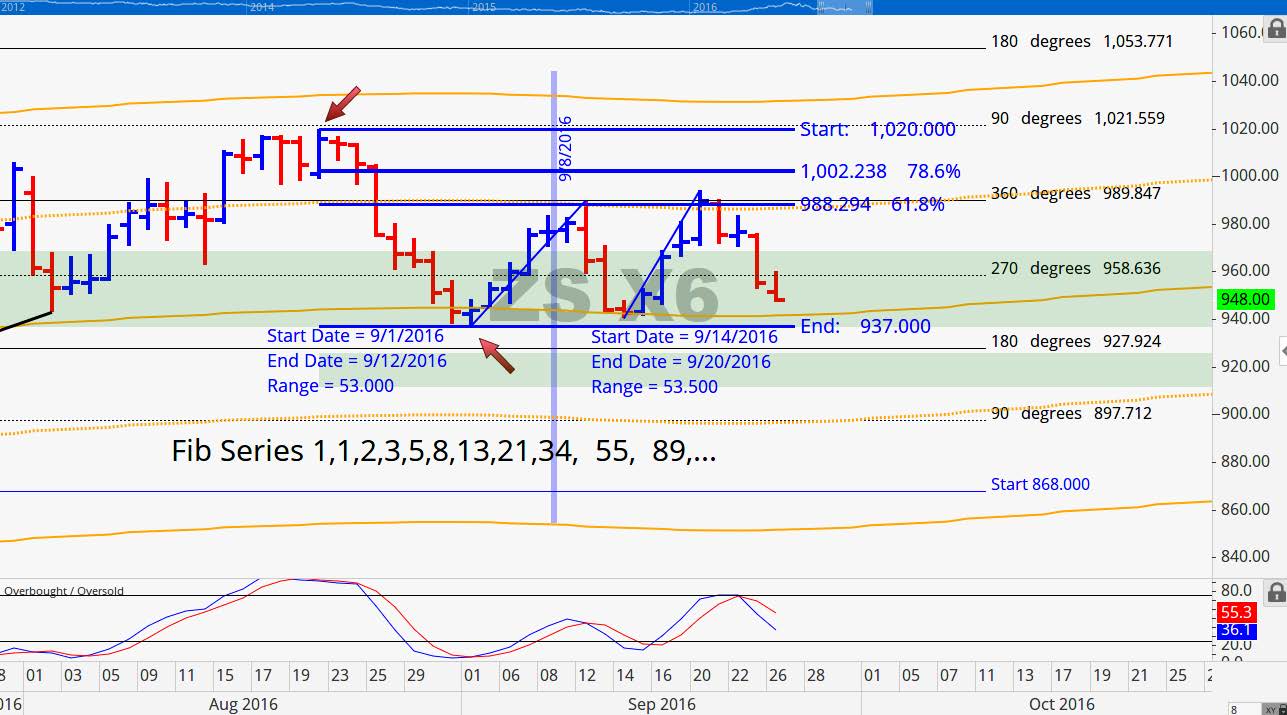
In spite of all the rain issues, the first Beans harvest progress report managed to come in on schedule at 4% for this time of the year. The life of contract low for this contract hit on September 1st. We did bit of digging and historically there have only been two other years on record that harvest low was made in September. Given the strength of the downside move to start week we believe that our projection for continued weakness is still valid that the contract low will be made in October eclipsing the September 1st low. Breaking 937 prior to breaking 990 this week suggests a minimum price objective of 900 with the possibility of reaching down as low as 880.
The lower doubled top projection was spot on near the Fibonacci retracement level of 61.8%. In the last couple of reports we listed 53 as one of the number in the Fib series. The actual number in the series is 55 not 53. The analysis still holds up but we did want to share this correction with you. Thanks to one of our astute subscribers.
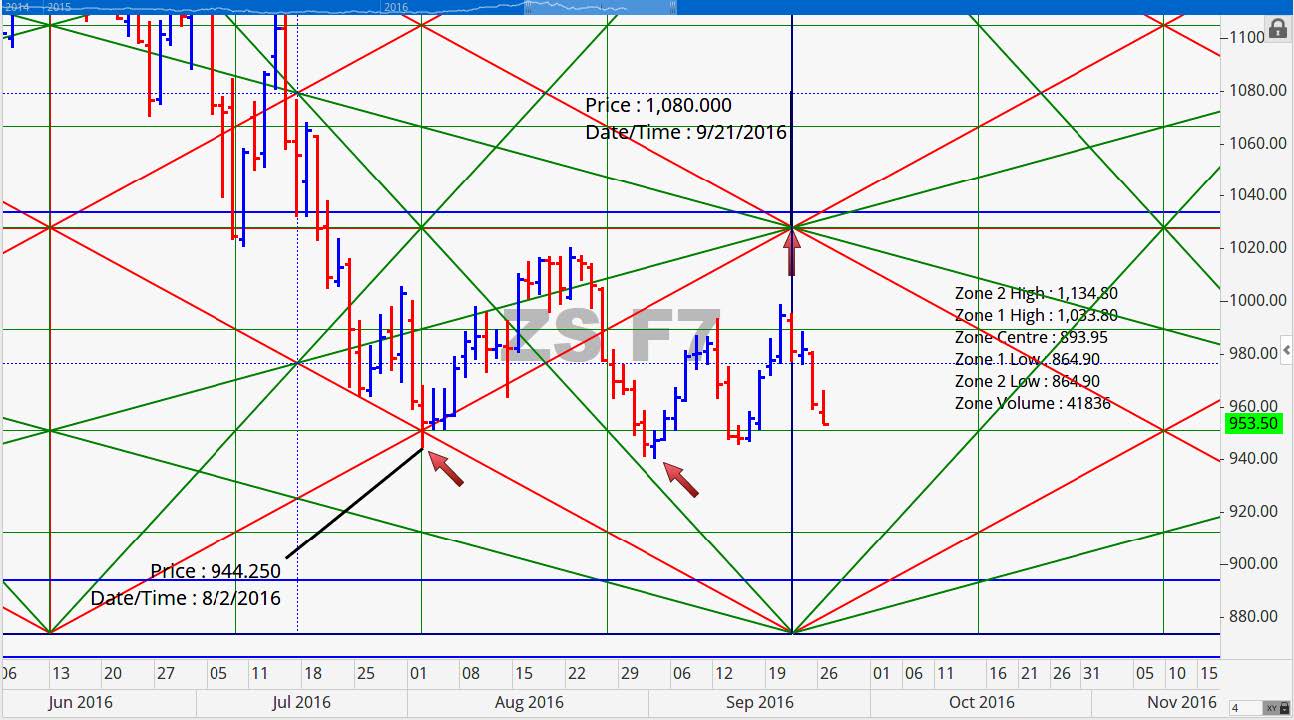
January 2016 Soybean Charts
January Beans tagged our sinusoidal resistance level when it reached 999 and that was the end of the line for him. In intraday trading it reached support at 955.50 but that level may not hold tomorrow if there is continued downside follow through. We were looking for a lower double top near 995and that is what we got. Now we are looking at a downside potential target of 925.
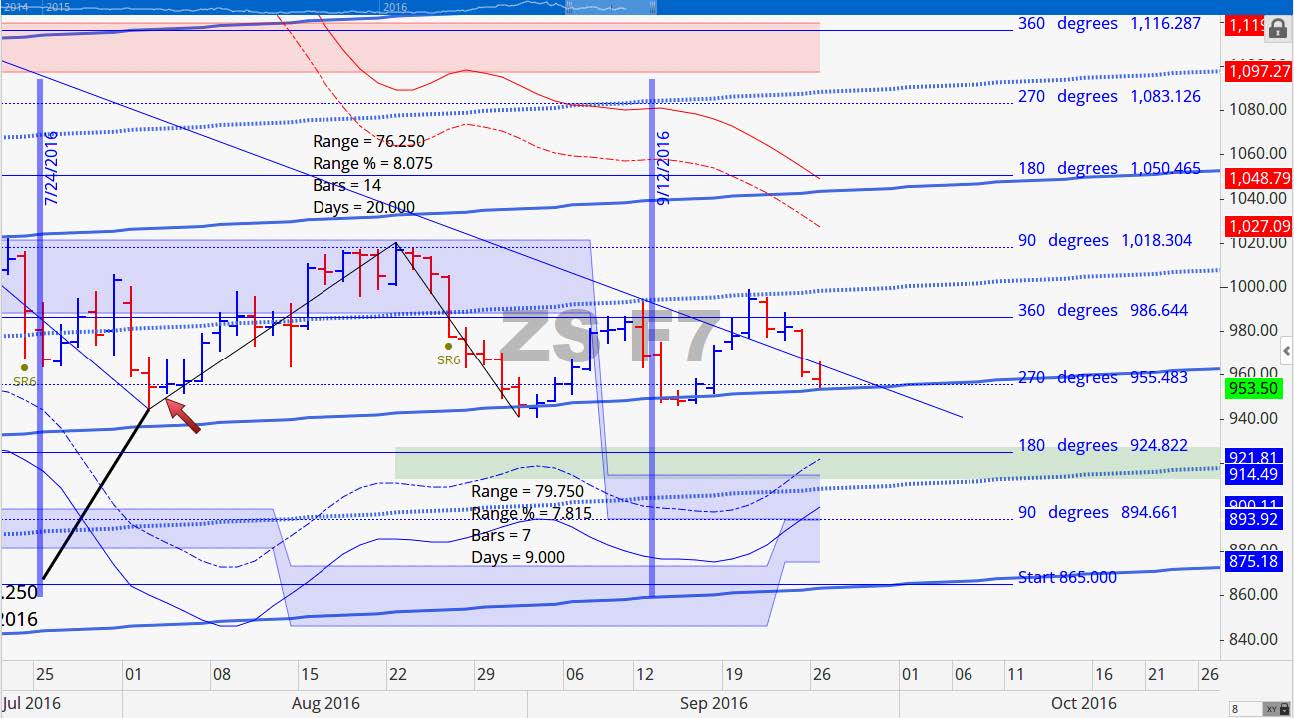
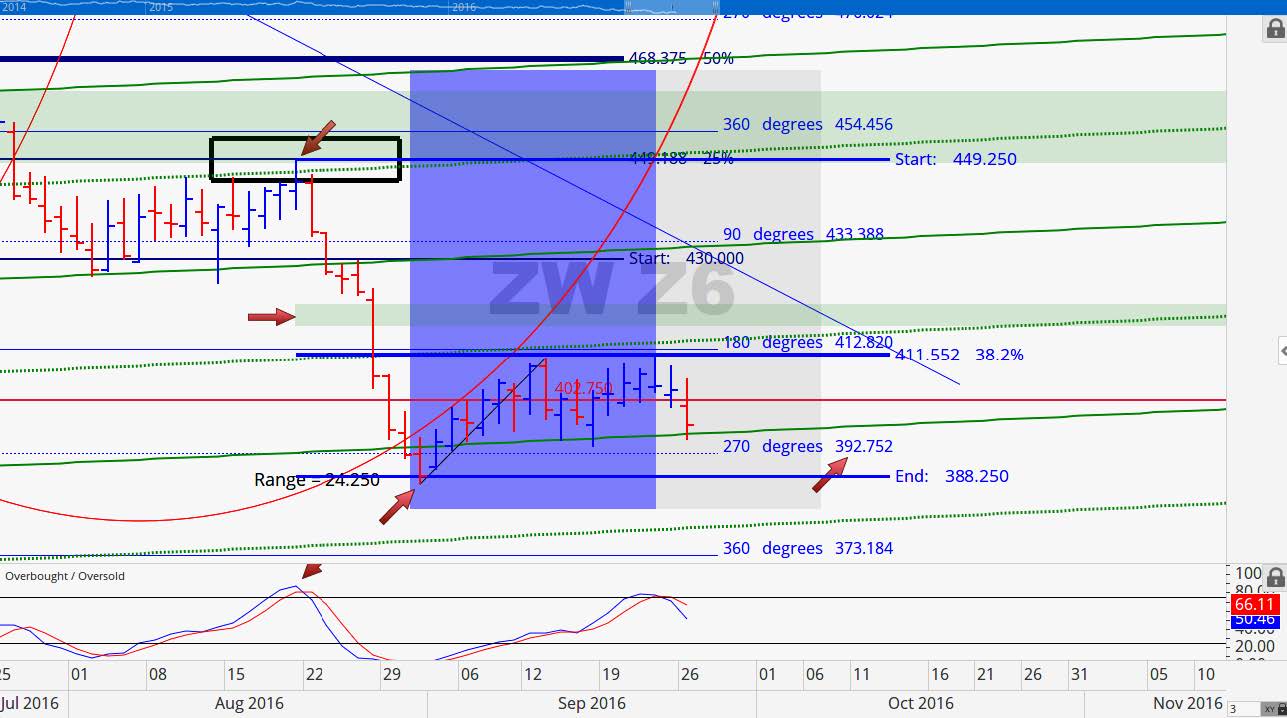
December 2016 Wheat Charts
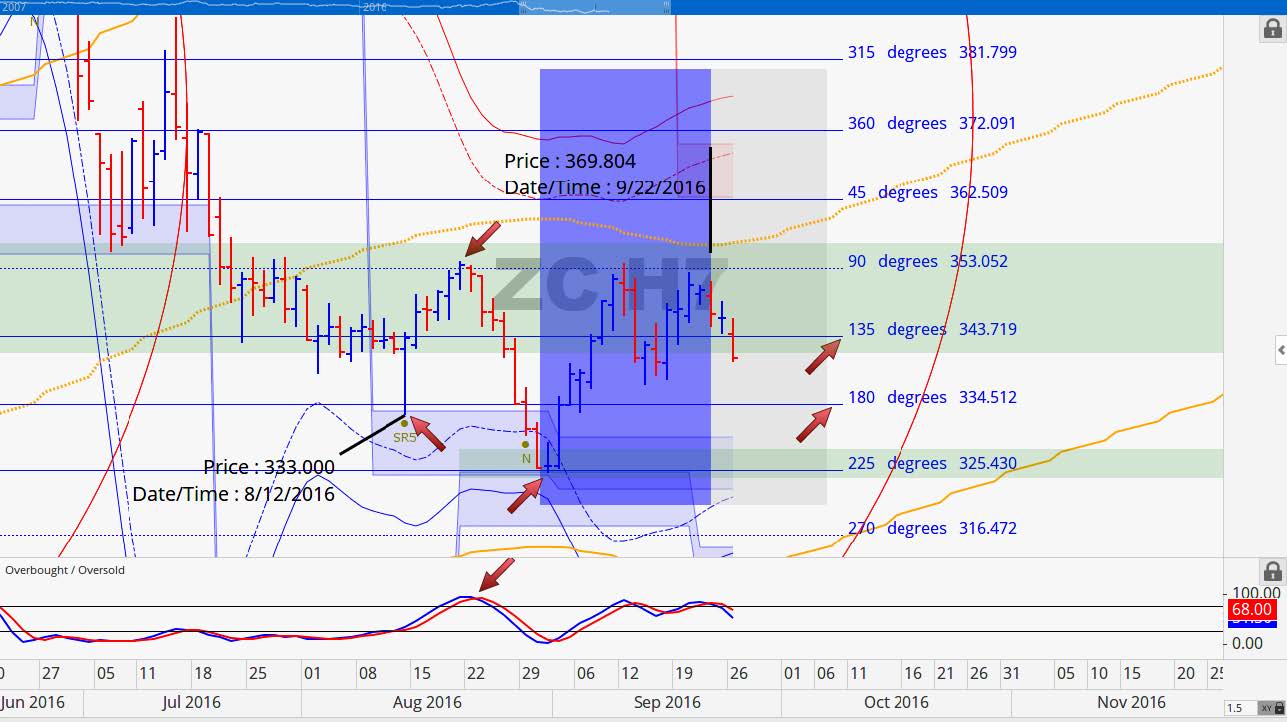
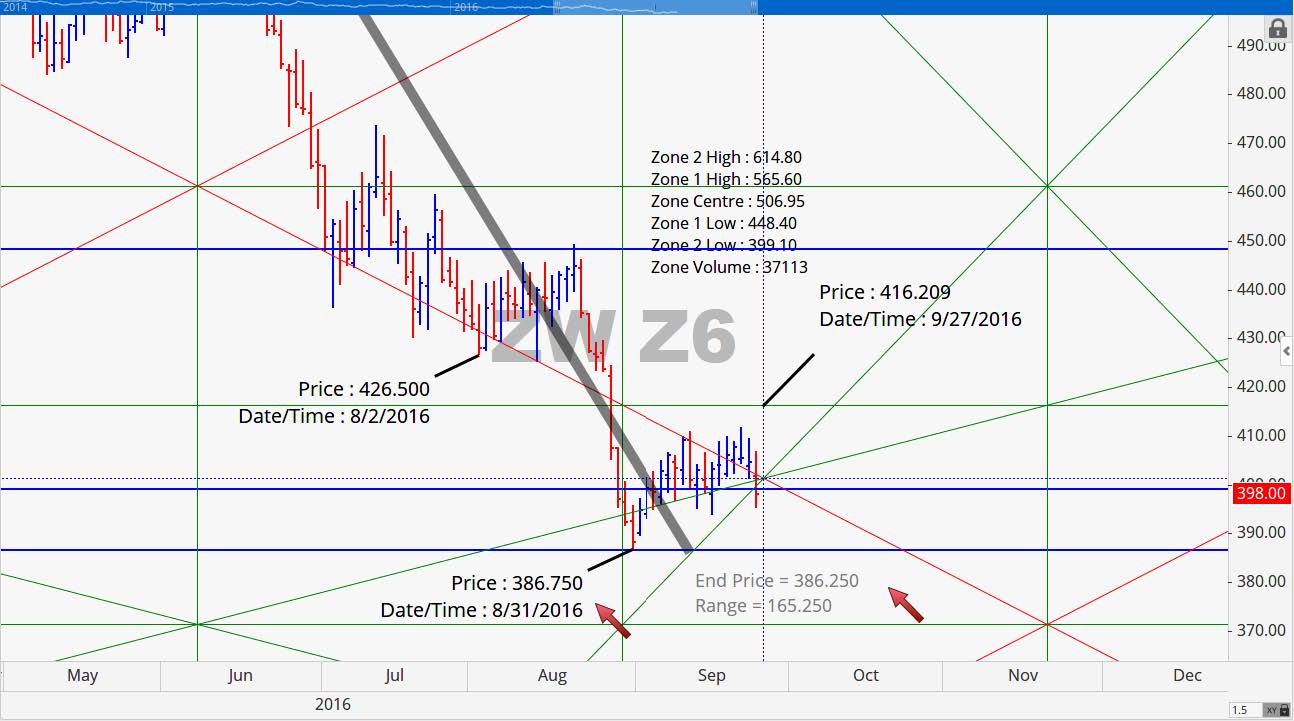
December Wheat is weaker today but against the backdrop of lower Beans and Corn prices is have done okay. We expected that Beans would drag it down a bit. For Wheat over the next 5 to 7 trading days were looking to see if the August 31st low is able to hold. If it is able to close above 413 prior to breaching the August 31st low then we believe that probability of moving higher into the middle of November is much higher.
As evidenced in the chart below, 411.50 has been formidable resistance. We have support at 392.75 followed by 388.25. Below 388 price will probably fall to the 373 to 375 range before finding strong support.
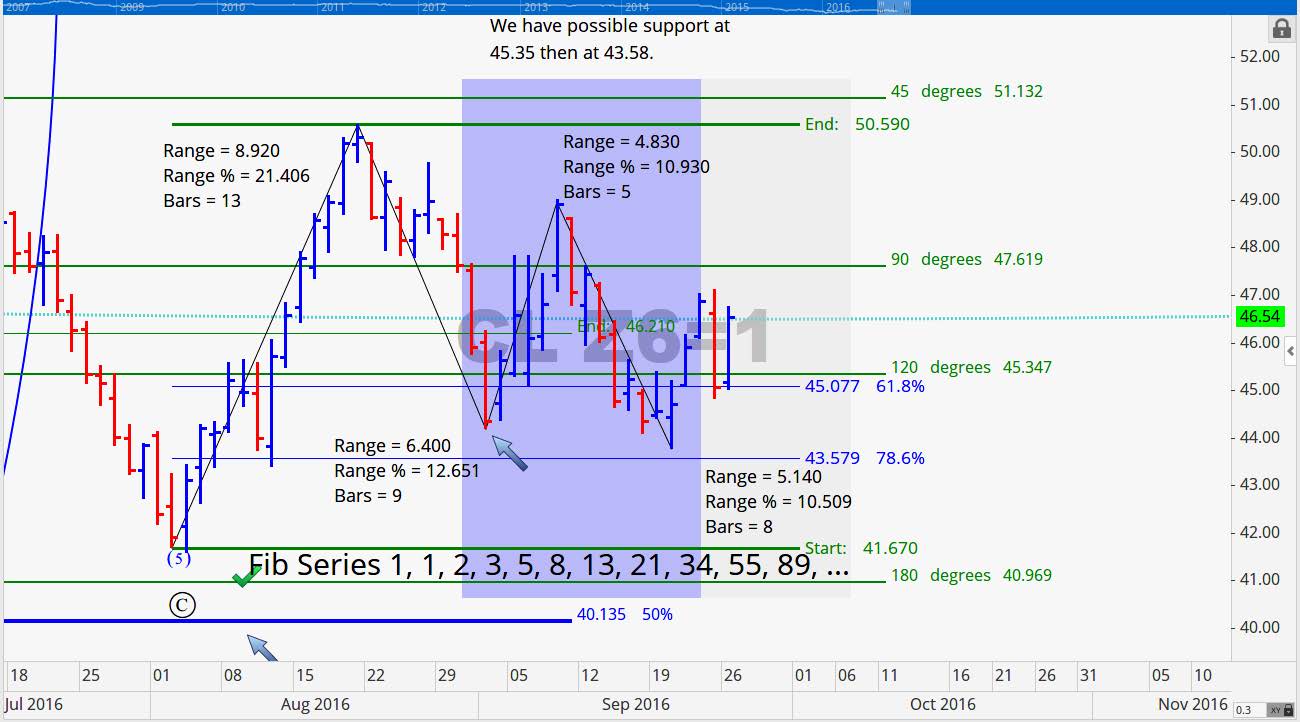
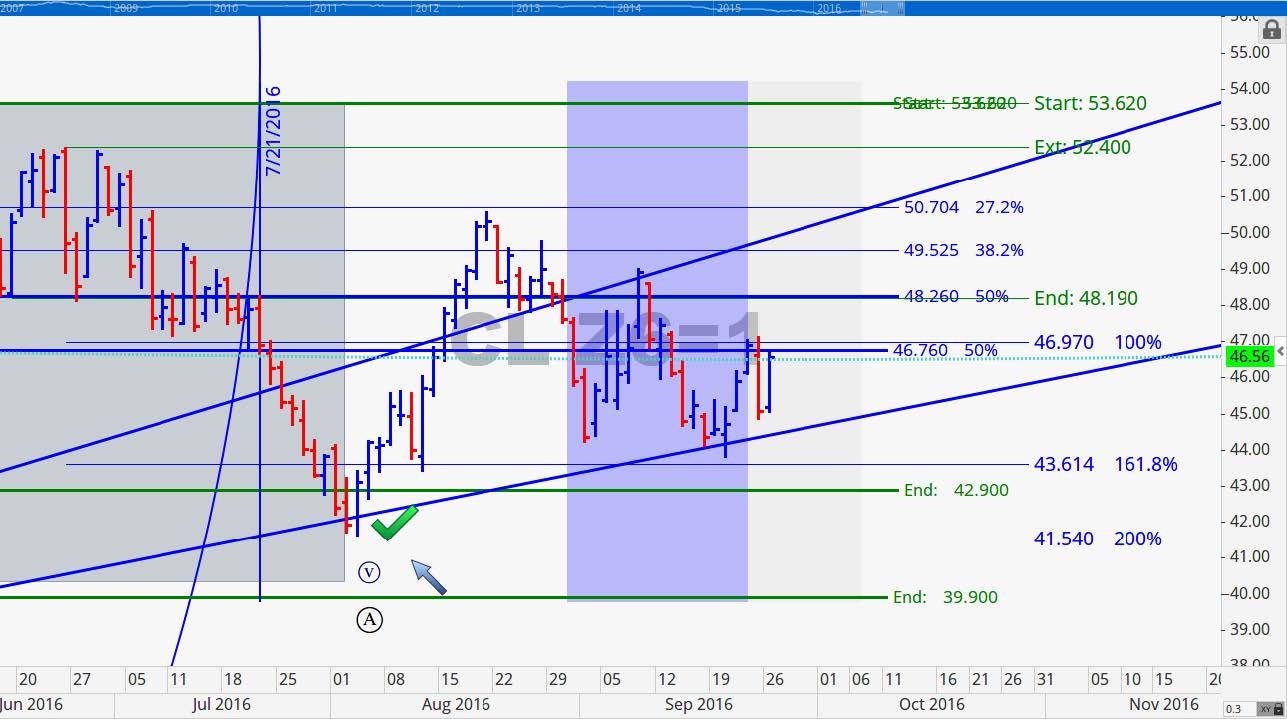
December 2016 Crude Oil
The time factor for Crude Oil was September 22nd (+/- a day or two either side) and we got a huger move down on the 22nd. We also go some new helped to move the markets. A possible deal with OPEC and non-OPEC members was circulating the newswires which made for some volatility. There is a September 28 meeting on deck and the possibility of reaching a production agreement is looking more probable. Prices really got a boost when Saudi Arabia offered to lower production if Iran caps output this year. Our key level for this contract at 44 held. Our 51 minimum price target is looking good with the possibility of reaching as high as 60.
Grain Market Overview October 11
Read more