
Grain Market Overview Sept 7
September 7, 2016Grain Market Overview Sept 14
September 14, 2016Commodity Market News Sept 12

Summary
The headliner of the day was the release of the USDA Weekly Crop report and Supply and Demand estimates. As would be expected over a week that was shortened because of the Labor Day weekend with a backdrop of slightly lower volume, Market Movers were able to prop up the prices of Corn, Soybean and Wheat heading into the weekend. December Corn closed the week with a solid 3.81% gain or 12.40 cents. March Corn kept pace adding 13 cents of its own for the week (or 3.84%). Not to be outdone, November Beans rose 27.75 cents or 2.91% and Jan Beans grew 28.5 cents (2.98%). December Wheat recovered some after two big down weeks rising 1.06% or 4.25 cents.
We have previously shared how important it would be to Managed Money to convince the average producer and the novice investor that prices would move up significantly from recent lows. Each day the market rose last week we saw evidence that market participants were increasingly more willing to “let things ride” and hope for higher prices instead of taking advantage of levels that were already profitable for them. This is exactly the kind of emotional euphoria that Managed Money is able to take advantage of. Once the average producer is convinced that the market is going higher and that there is not real need for a ‘Risk Management Protocol’ you can guess that a high is probably around the corner. It is during these windows of opportunity that Managed Money systematically unwinds their positions and the average trader is only able to respond after the fact. They wait for evidence from the likes of the CFTC’s COT report but again that is sometimes too late.
The industry was looking for today’s report to trim Corm production estimates as well as a reduction to the Beans ending stocks because of weather complications. Even though Wheat was up on the week, it’s trading range over the past two weeks has been very narrow. Per the USDA Report today the Soybean Crop production came in at 4.201 Billion Bushels (BB) versus 4.060 BB last month. The trade estimates were between 4.019 to 4.162 BB. Futures were up ahead of the release but that was short lived and futures were down more than 20 cents over the course of intraday trading. Corn production was at 15.093 BB down from last month’s 15.153 BB figure. It was right in line with trade expectations that ranged from 14.757 to 15.30 BB. US Soybean Yield was strong coming in at 50.60 Bushels per Acre (BPA) well above last month’s 48.9 BPA. The trade estimates were from 48.1 to 50.1 BPA. US Corn Yield was in line with expectations at 174.4 BPA below the 175.1 last month. The trade was calling for somewhere between 171 to 175.6 BPA.
Corn
The harvest is underway. Corn posted a strong price action showing last week and was even up a bit in early trading but it has since softened after the release of the USDA report. The USDA announced that it has begun to include the status of the Corn harvest in its Weekly Crop Progress report. Managed Money is officially holding 27.2% of all short positions according to the CFTC’s COT report. That is a very large number given that it is only ½ of a % from the all-time high level of 27.7%. This makes for some interesting trading fodder. We had been looking for Corn to enter into a low volatility phase as the industry tries to make its way through the expected supply. Since Managed Money is holding such a large percentage of all shorts a higher low in Corn could make for quite the interesting short squeeze when Managed Money starts to unwind. If the low volatility phase persists then look for managed Money to systematically unwind near the lows. That would perhaps be the most profitable scenario for them. We are looking for the harvest low in Corn to hit in mid to late October.
December 2016 Corn Charts
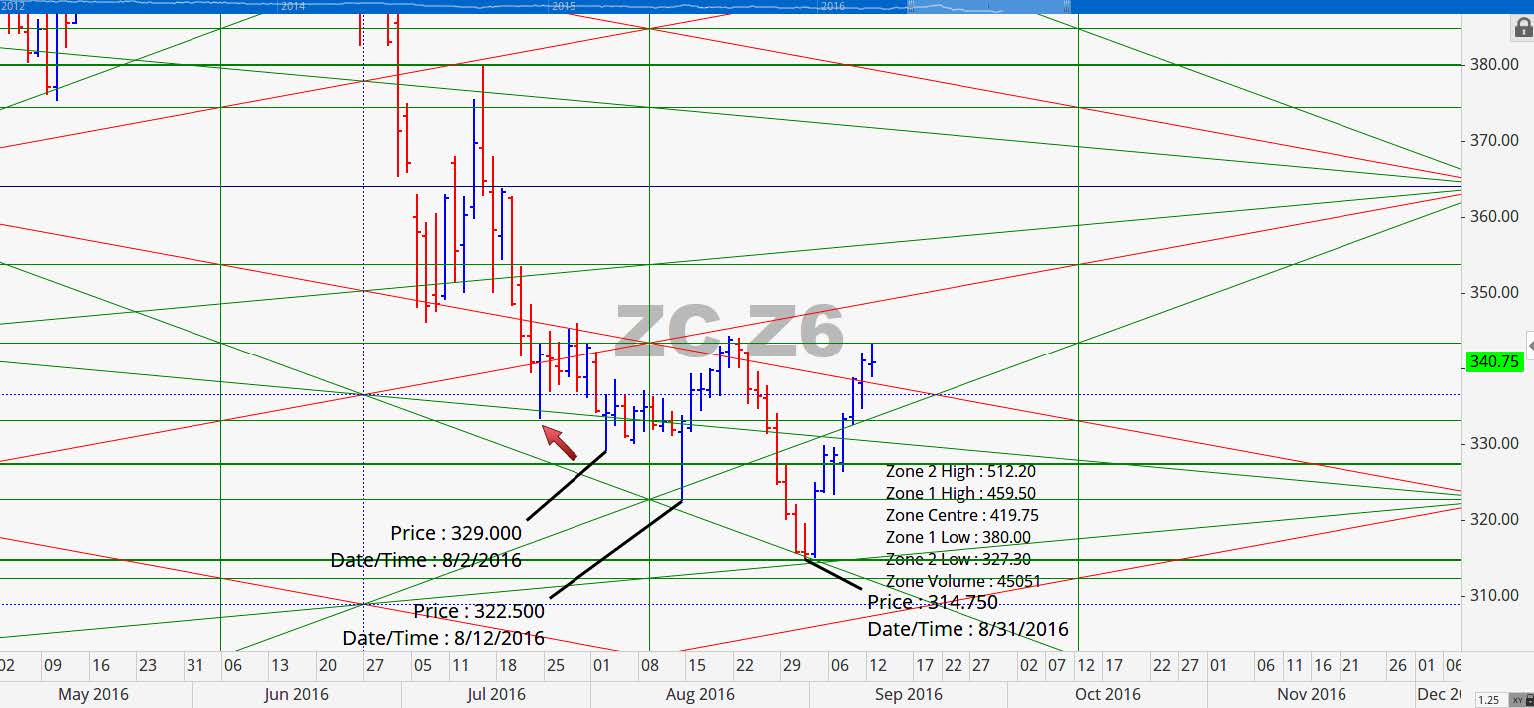
December Corn continued to move higher from our natural support line at 314.75. It crossed our 329 level closing above and is poised to test resistance at 347.50. If this market falls from resistance at the 270 degree mark then finds support at 329 Corn could be in for a run up to about 366. For now we anticipate that it may have some trouble getting past 347.50.
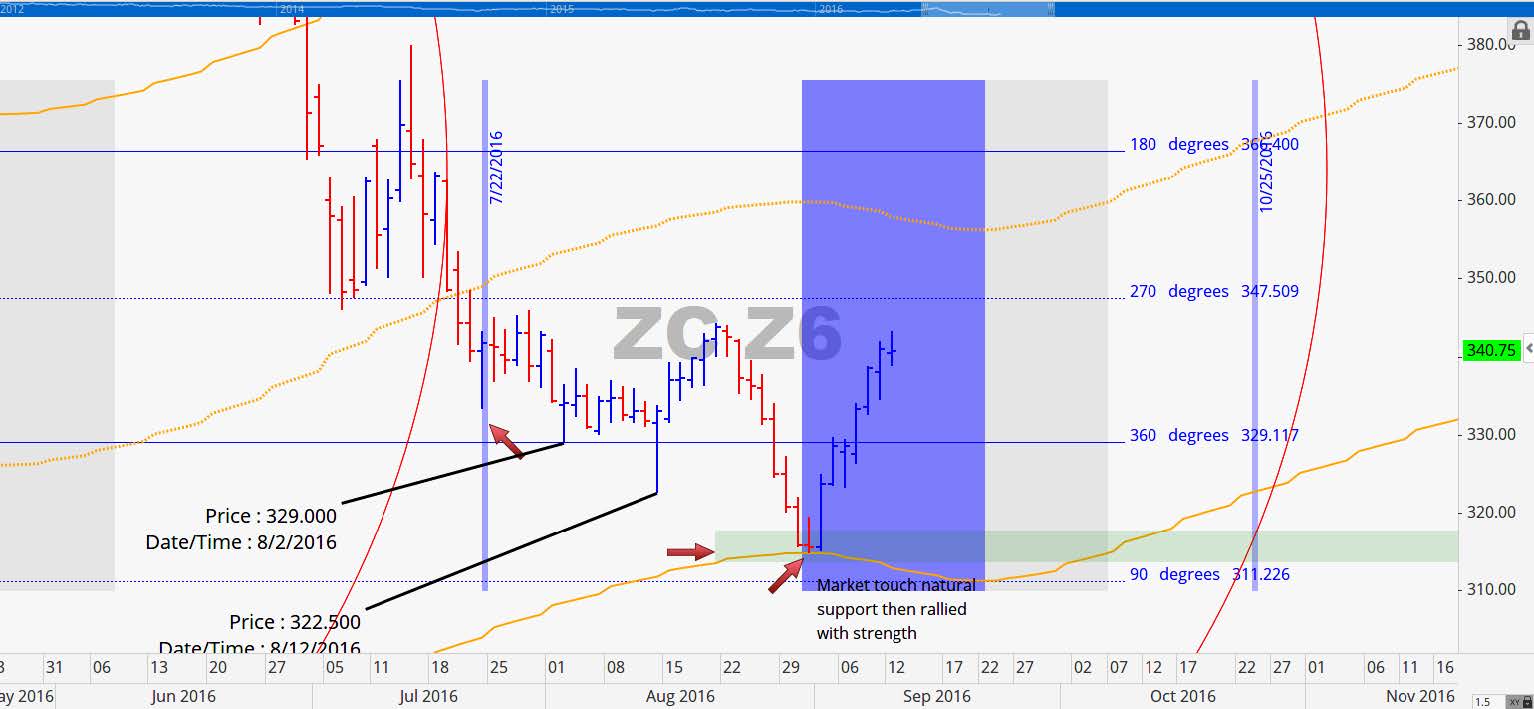
The strength last week has shifted the two levels below the point of control to 380 and 327.25. Between 327 and 329 should prove to be solid support for this contract this week. The initial long entry near the 318-320 price level continues to be a great trade and upon hitting 329 would be at risk free. The final price objective would be in the area of the previous swing high at 344.25 or at 347.
March 2016 Corn Charts
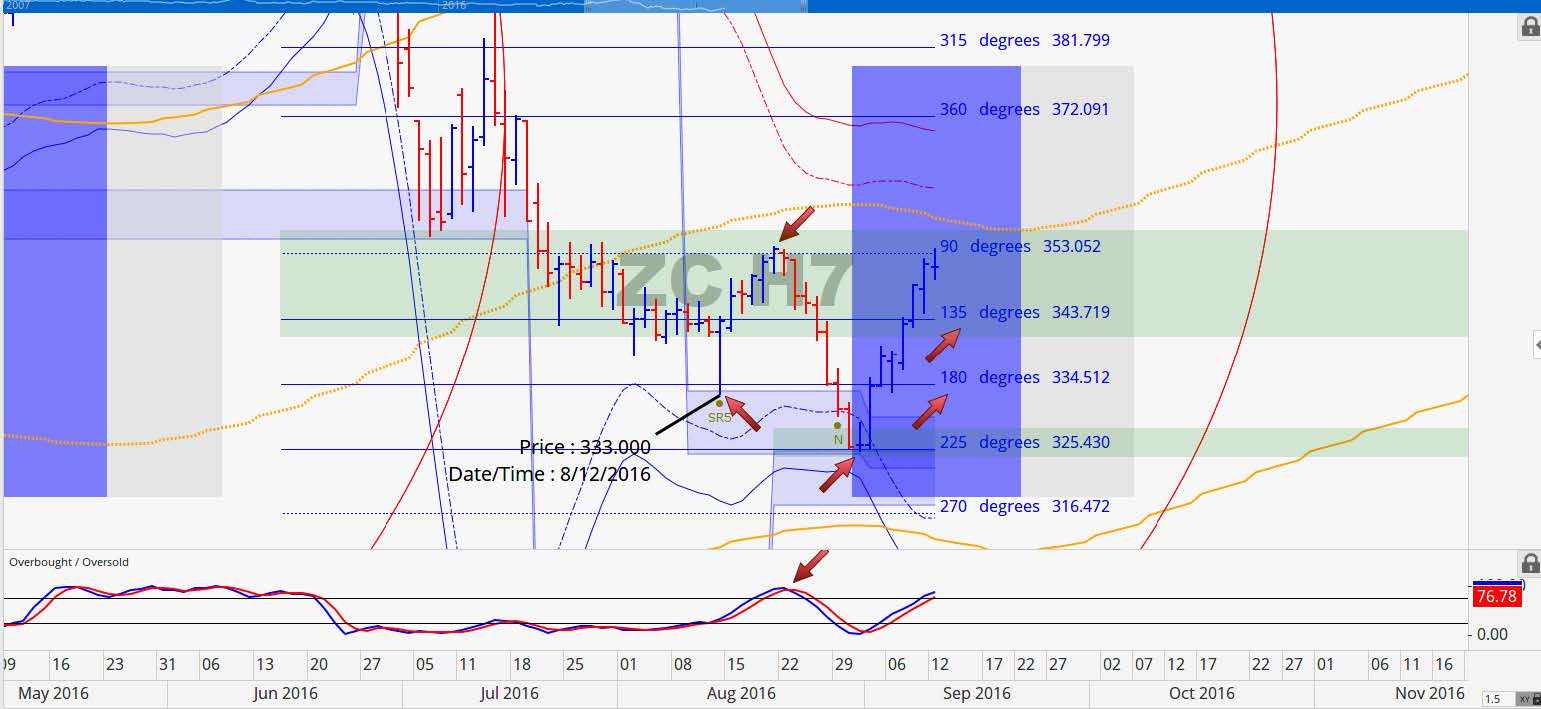
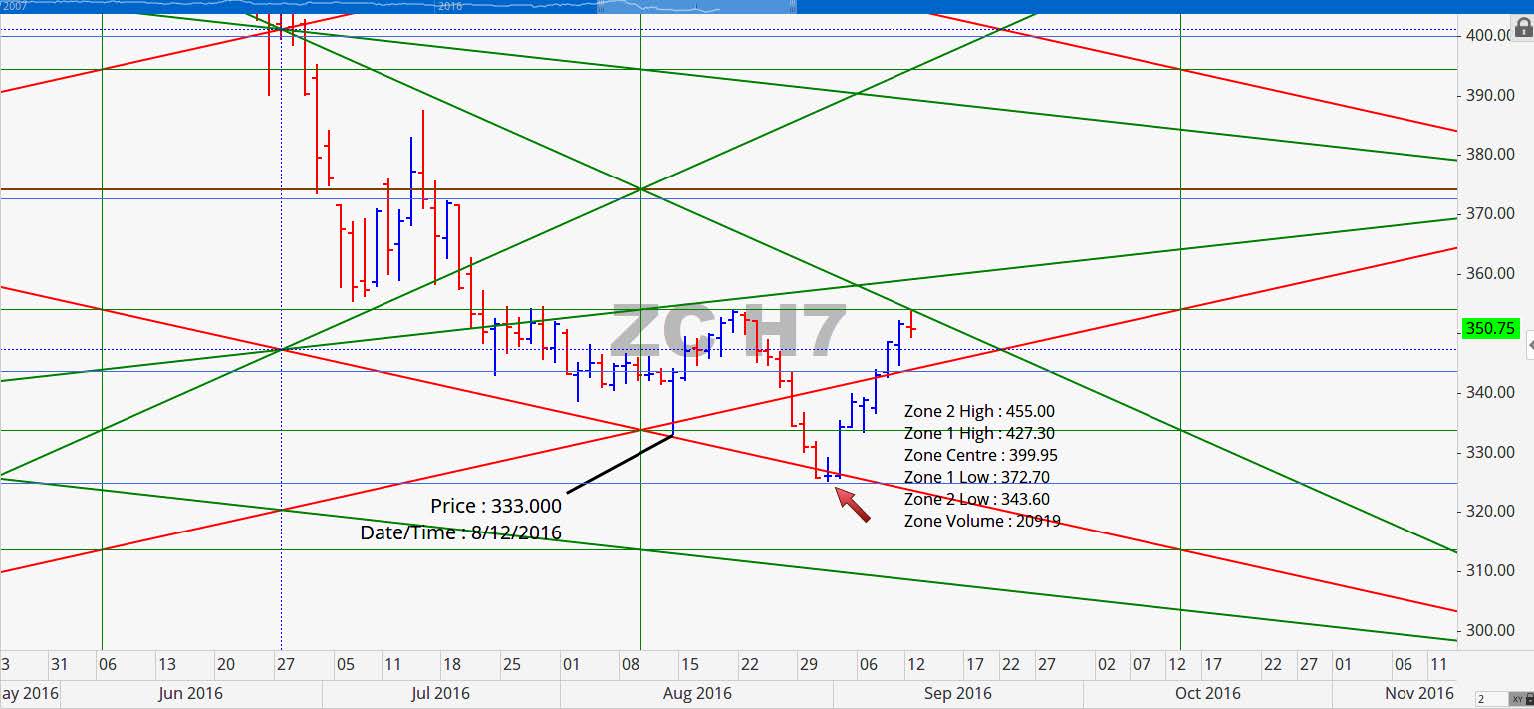
The strength last week has shifted the two levels below the point of control to 380 and 327.25. Between 327 and 329 should prove to be solid support for this contract this week. The initial long entry near the 318-320 price level continues to be a great trade and upon hitting 329 would be at risk free. The final price objective would be in the area of the previous swing high at 344.25 or at 347.
Soybeans
The harvest is about two weeks away from starting. So the wetness needs a little bit of time to dry up a bit. On our charts we had both September 8 & September 12-13 as possible windows for a change in trend for Bean futures. The latter coincided with the USDA Report which suggests that the latter set of dates are more likely to end up being a pivotal turning point for Beans. The initial response to the report was a big decline in prices but we would like to see another day or two of seller’s bars to confirm a change in trend. Historically this report tend to line up with a change in trend. When it does not produce trend change September 21st is a close 2nd in being a time factor that produces a trend change. We are looking for a key low to be made in early October.
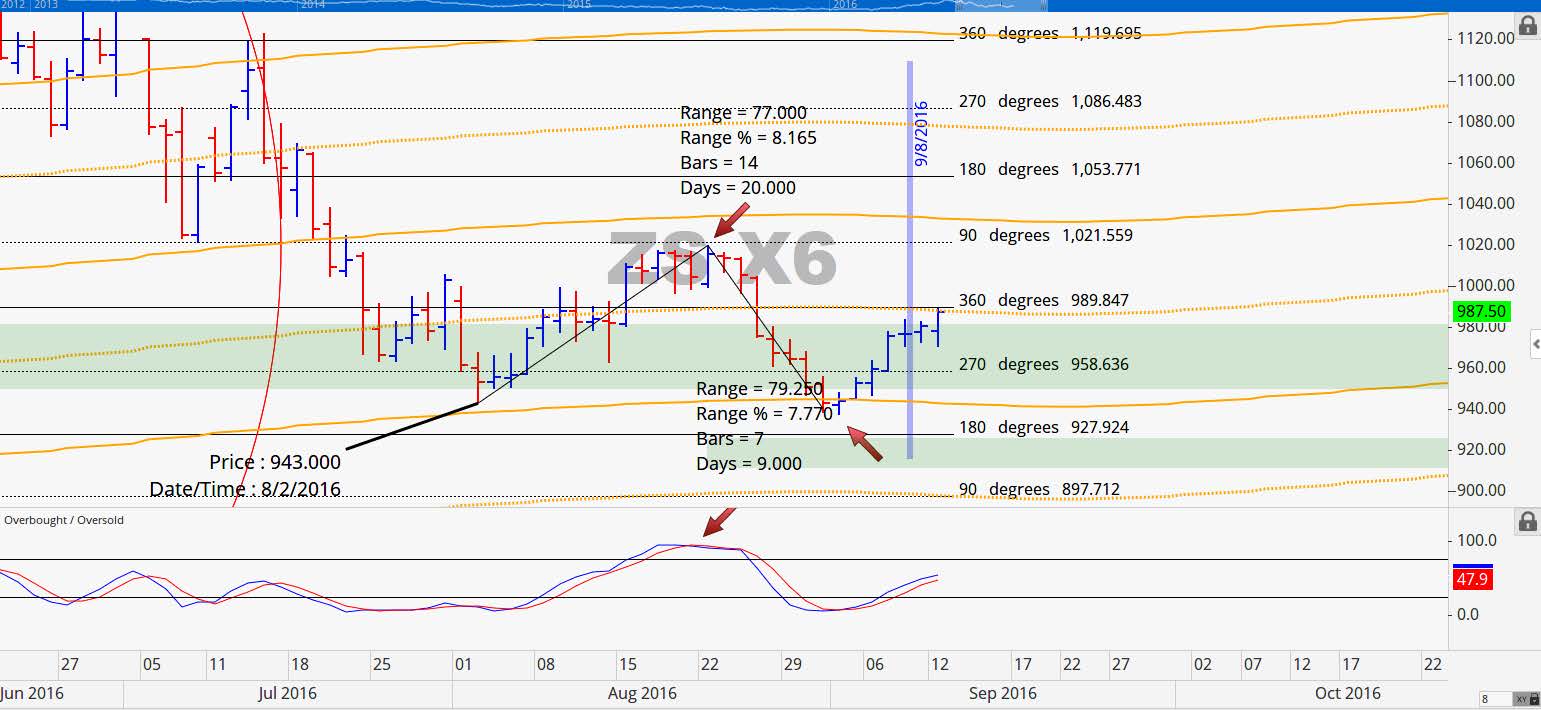
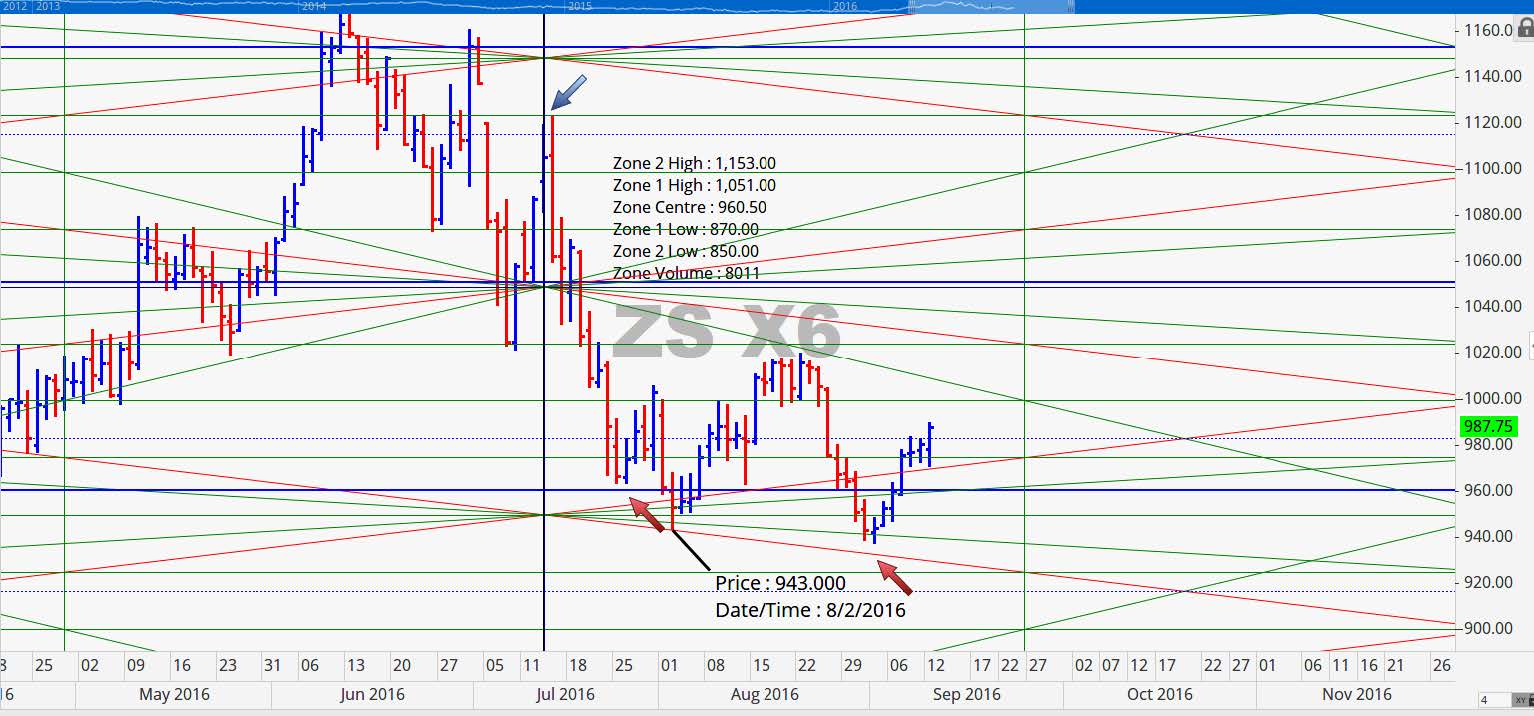
November 2016 Soybean Charts
This contact paused for a day after hitting the September 8th potential turn date. The next day was an inside bar followed by an outside bar today. The day started out with strength but looks to end the day weaker. So the September 8th date essentially carried over one trading day to the next window of September 12-13. A close below 958.50 tomorrow and we are looking at a potential move down to 900. The first area of potential support would hit at 928. Like last week, we have key levels at 990 (today’s high), 958.75 (today’s low) and 928.
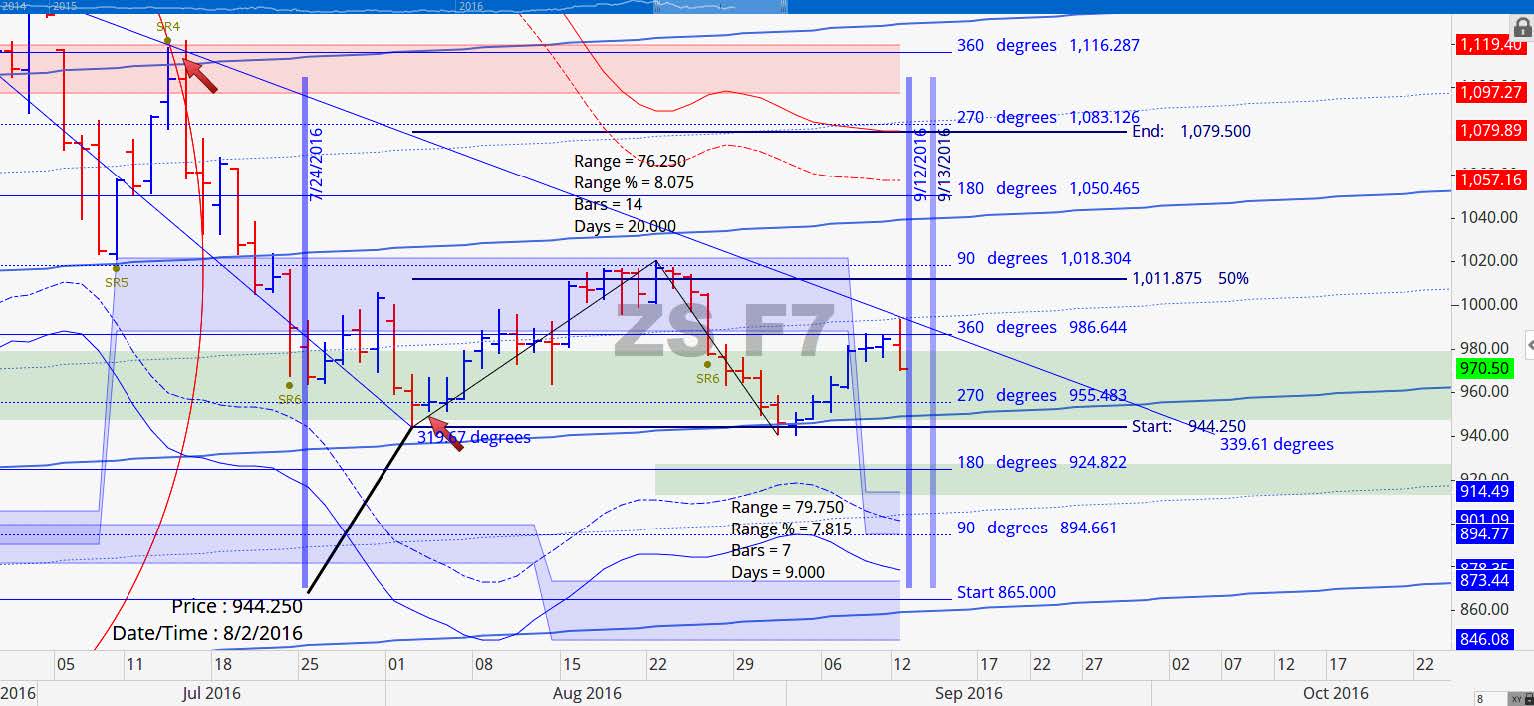
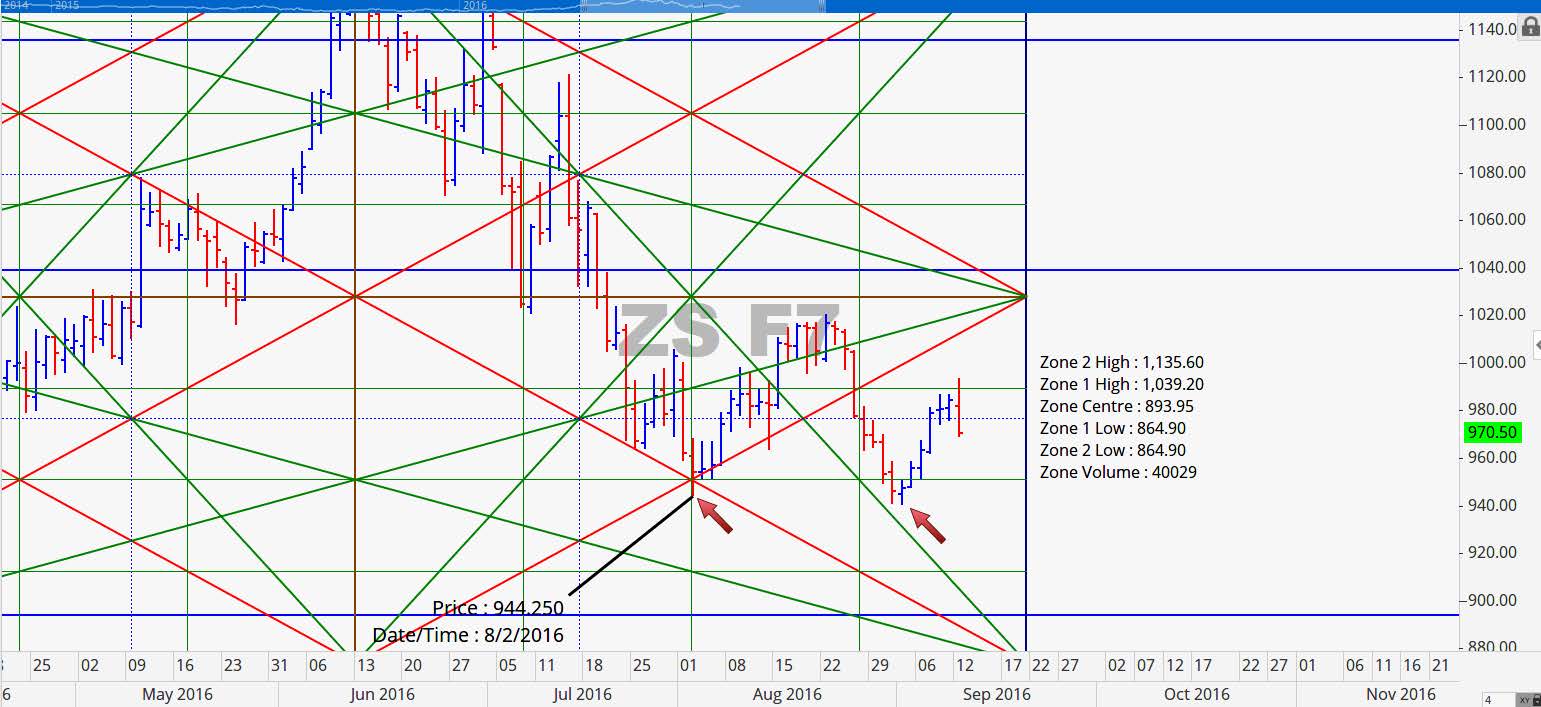
January 2017 Soybean Charts
Overhead resistance at 986.75 was significant and anticipated and even though price moved above it marginally today it traded back below by the end of the day. We are looking to see if the September 12-13 wind hold up as a pivot for Beans. The key levels overhead are at 1018.50 and 1050.50. Support below lives at 925 and 894.75.
Grain Market Overview October 11
Read more