
Grain Market Overview Oct 19
October 19, 2016Grain Market Overview Oct 26
October 26, 2016Commodity Market News Oct 24

Summary
The US Presidential election is only a few weeks away, and our nation has become much more versed about the notion of hacking thanks to Julian Assange who caused many individuals to create better passwords for themselves and/or to incorporate ‘two factor authentication’ for their accounts. Regardless of where you land on the political landscape, the importance of internet security is not something one should turn a deaf ear to. On Friday many individuals on the East Coast fell victim to denial of service attacks, including websites such as Twitter, The Verge, Amazon, Spotify and many others. DYN, a domain name service (DNS) company, which routes internets users to the correct websites was the target of the attack. The events from Friday show how vulnerable our infrastructure may in fact be.
The overhead resistance levels that we laid out for Corn, Wheat, Beans, and Crude Oil last week all held up very well. Both Corn and Soybeans realized some increased demand but most of the bullish interest seemed to rest with Soybean futures. According to Friday’s commitment of traders report, the investor net long beans position rose 19,483 contracts to 88,272. That would have us believe that bullish bias may be setting in for Beans. The net long positon size is the largest in two months. End users have clearly been taking advantage of the seasonally low prices, suggesting that Beans may pull out of its sideways congestion to the upside. Investors have also trimmed their bearish stance on Corn by moving to a net short position of 51,986 versus 121,914 from the previous week. The net short Soft Red Winter Wheat position was also on the decline falling 36,378 contracts down to 100,865.
Despite their massive reserves, China has halted auctions for their unused Corn through May 2017 in an effort to push buyers to purchase grain from their current harvest. The USDA has pegged the Chinese Corn stock at 103.7 million tons versus the 200 million tons that is being reported by the China National Grain and Oils Information Center. US Corn inspections hit its lowest level for the marketing year at 875,808 tons, falling below 1 million tons for the first time in almost 4 months. Export sales were strong last week, but this mixed batch of data is consistent with the price movement that we saw Corn last week. Resistance reigned supreme for Corn last week and even out of the chute today price was under pressure – unlike Soybeans that came out of the gate strong. December Corn closed the week down 1.75 (0.49%) and the March contract was down 1.50 (0.41%).
Soybean futures were strong overnight then eased off in early to midday trading. By the end of the day the price returned to strength. Last week the USDA export sales for Beans highlighted great demand. Since the beginning of September, Bean sales are up 26% measured against the same time period last year. Unlike Corn that had down weekly close, the November contract was up 20.50 (2.13%) and the January contract was up 22 (2.27%). The trajectory on the weekly chart is turning to the upside, and today prices hit levels last seen in August. The expiration of November contracts is undoubtedly playing a role in the upside that we are are seeing. Managed Money is closing net short positions but is not re-entering those short positons with forward contracts.
Wheat futures was the weakest of the three markets last week. The December contract was down 6.50 (1.54%) for its weekly close and Beans was not strong enough to pull it higher today. In fact, it lost more ground than Beans gained when the dust settled.
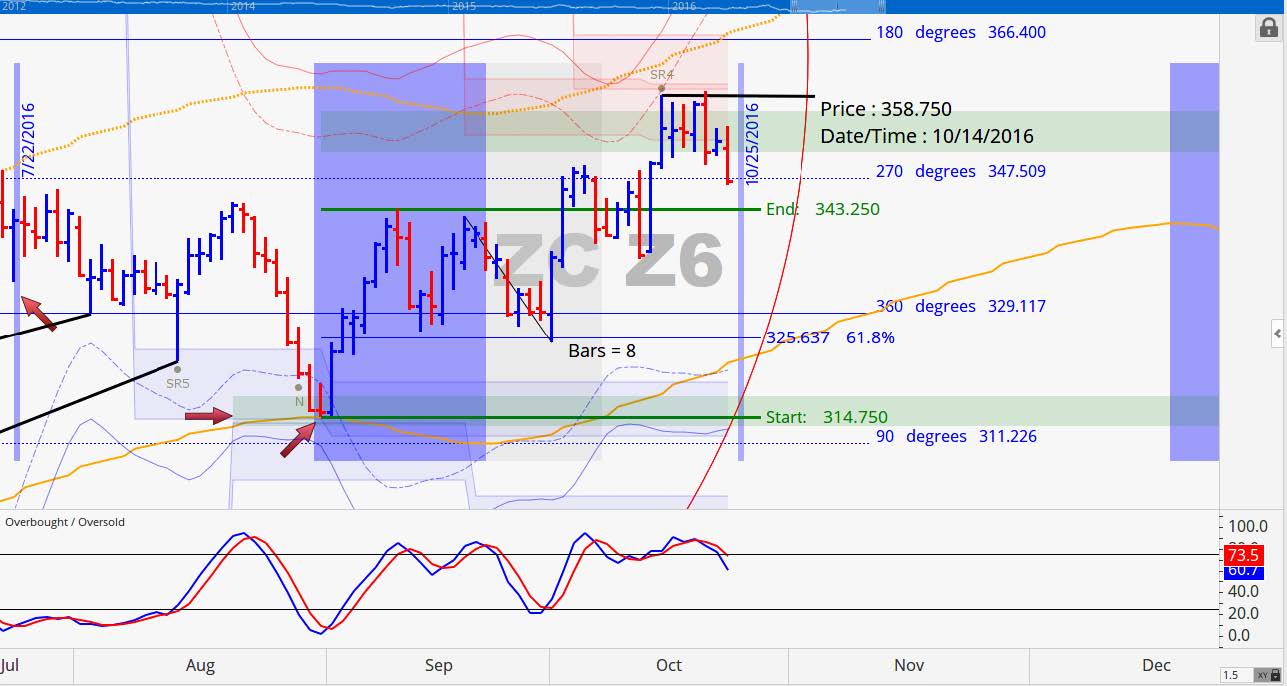
December 2016 Corn Charts
Resistance at 358.75 was very important last week. As evidenced in the chart below, that level was at the overlap area of the volatility based resistance zones. These overlap areas consistently prove to be great resistance spots. Upon hitting this area, the momentum will often pause and churn sideways or even reverse and move down. We had held out a cash sales recommendation in the neighborhood of 353-354. The stochastic pattern continues to unfold similarly to the September 9th to 22nd time period. If the pattern persists, look for price to continue sideways or lower until the stochastic bottoms. If we close below 343 tomorrow, and closes below for the weekly close we would be looking for price to reach 329.
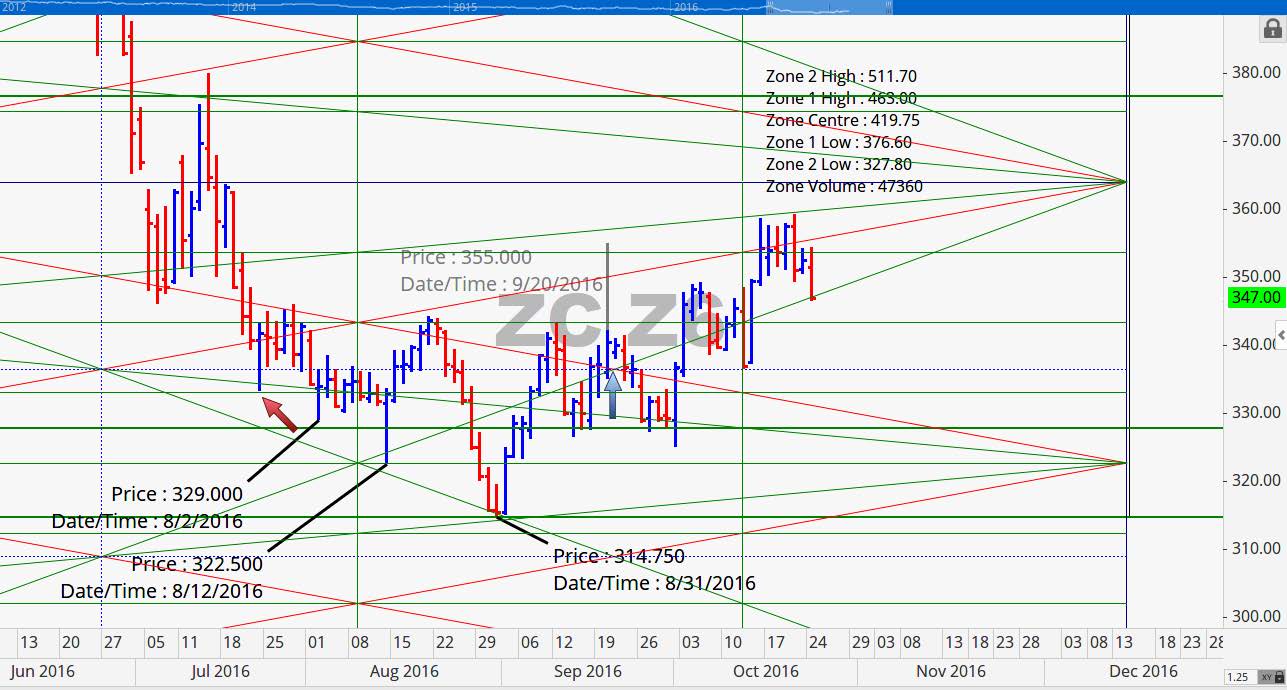
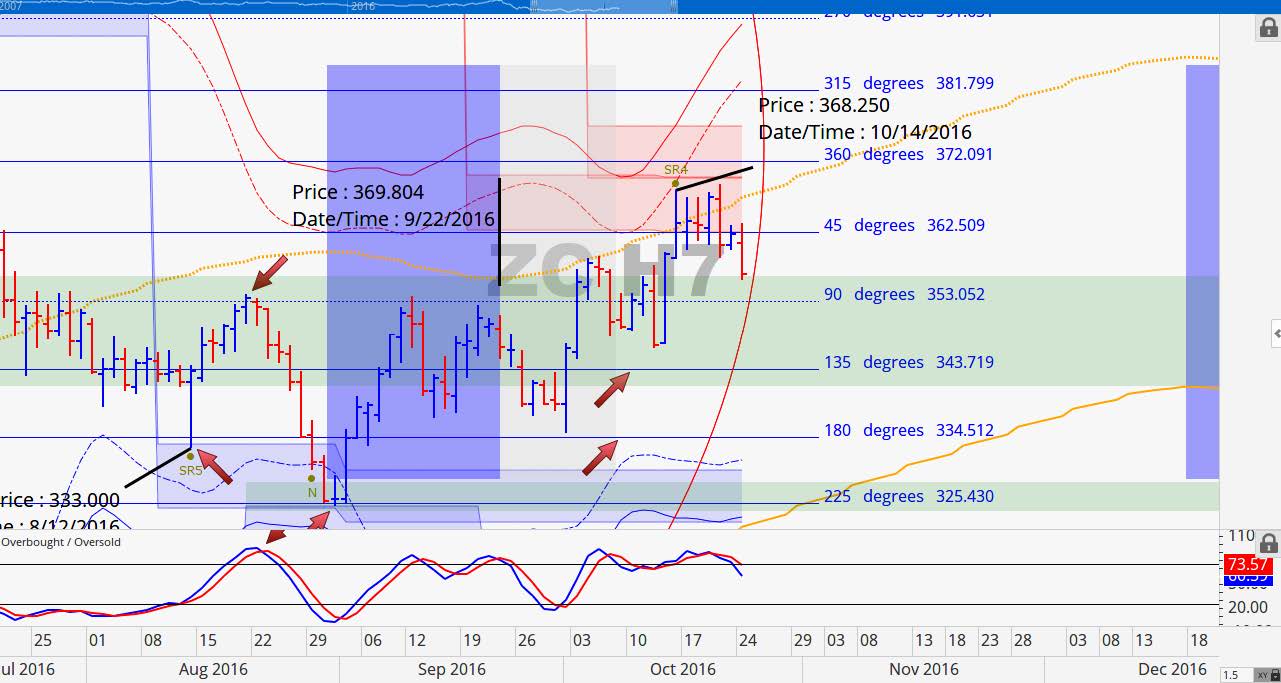
March 2017 Corn Charts
As of last week the Corn harvest came in at 46% complete which is just shy of the 49% 5-year average, and behind last year this time at 54%. Corn prices were holding up last week because of strong demand seen in the export number over the last several weeks. The projected record 15.057 billion bushels is perhaps starting to get priced into the market (especially in the March contract). This week are looking at 353 at a very important closing level. If price is able to close above, we could see a persistent move to the upside through Thanksgiving.
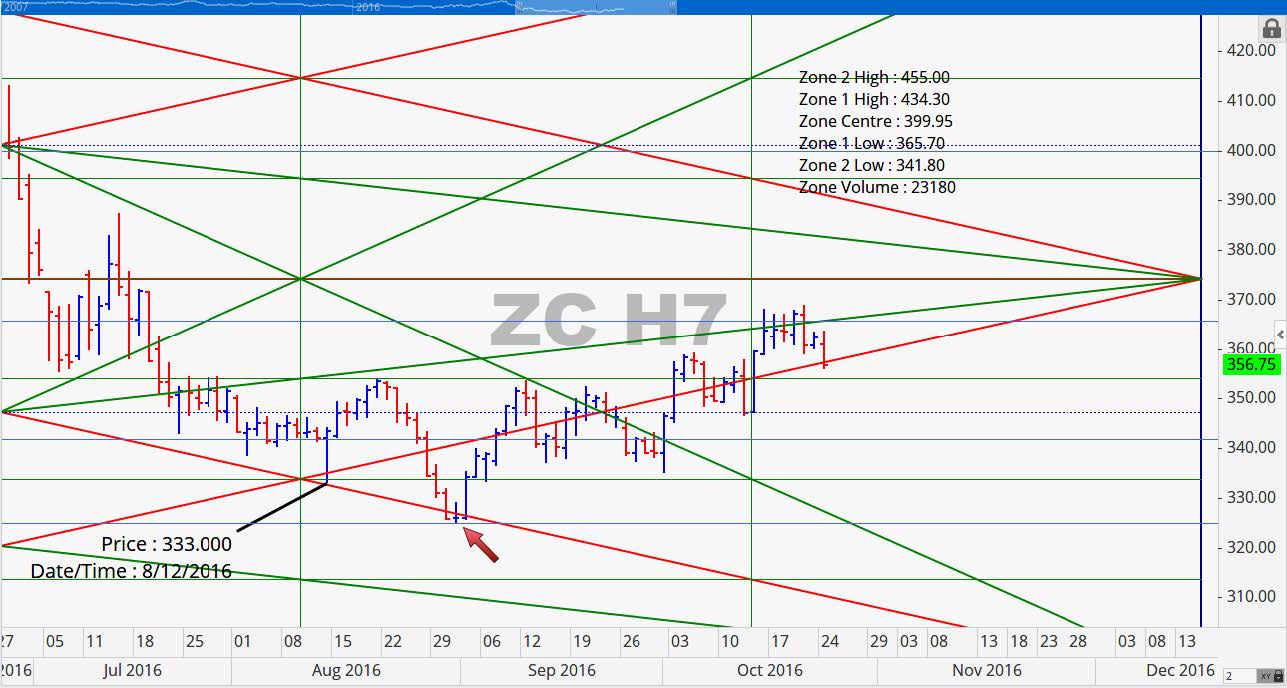
The downside point of control support level has moved up from 341.75 to 342 this week. This contract has been consistently creeping higher from the August 31 low. On October 12 it made a low at 346.50. That low lined up with our vertical time factor. So, even if this contract were to break the 353 this week, if it subsequently turns up from 346 after reaching a stochastic oversold position, price could still have a good chance gaining strength from there.
November 2016 Soybean Charts
November Beans still has a shot of reaching either 1002 or even 1020. Last week it advanced on Monday, Wednesday, and Friday, while pausing a bit on Tuesday and Thursday. It picked up where it left off on Friday with an impressive showing. Today’s close at 990.75 was just above the 360-degree mark of 990, and the stochastic indicator is starting to show that we might be moving from a consolidation to an uptrend. Historically the Soybean harvest low is made in October. At this point it is starting to look like the harvest low might have occurred in August. In the few occasions when the harvest low is made in August, it is often an indication that managed money or larger players anticipate a disruption in Brazil’s Soybean crop. There is nothing to suggest such issues as of yet, so we can only speculate as to what may cause an August low this year.
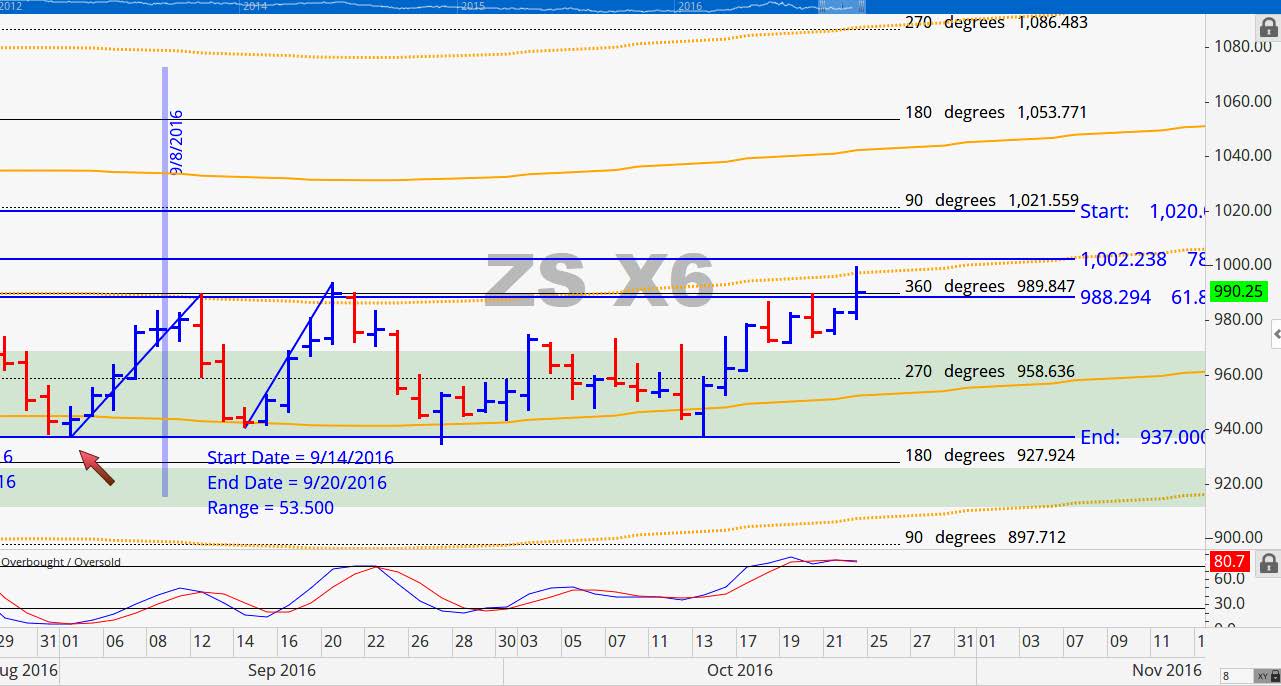
Price has moved up very nicely from the blue horizontal line at 960.50 (a nodal point for this contract). Price is not testing an extreme distance from the nodal point and if price is able to get significantly higher we could see price spring from here very quickly. A close above 1002 would be the signal that suggests that price reached 1020 in short order.
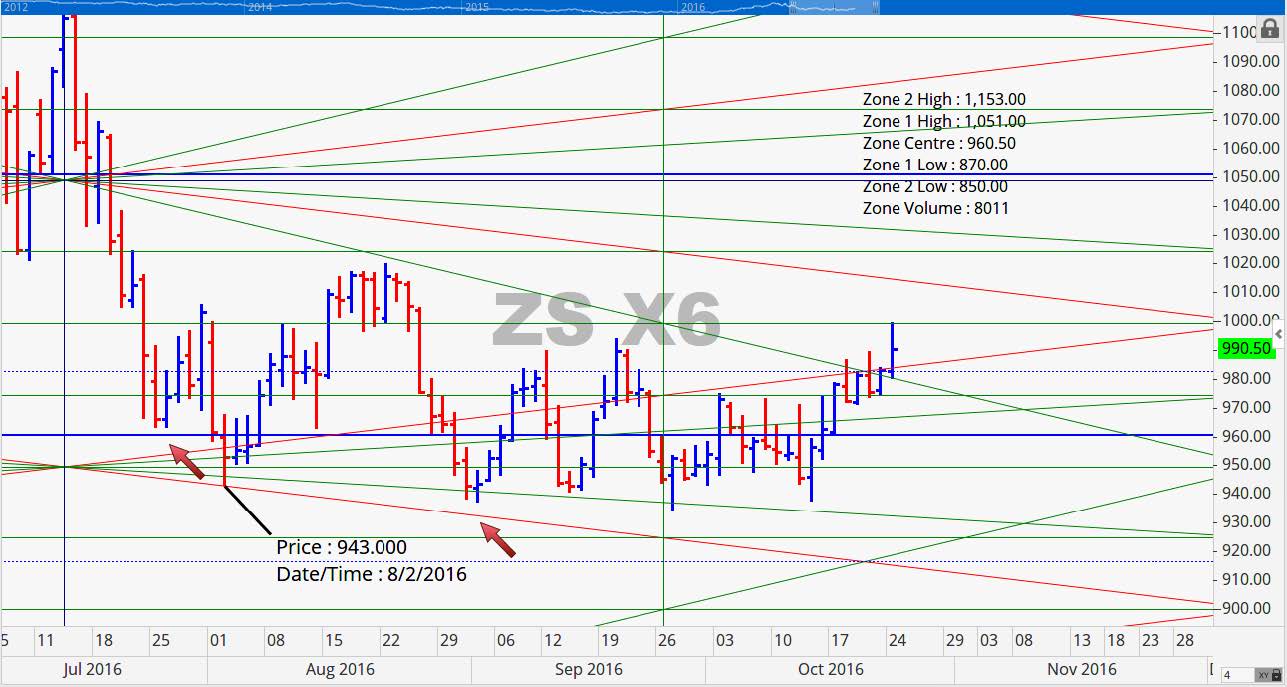
January 2017 Soybean Charts
Soybean is 62% harvested versus the 5-year average at 63%. A year ago this time the crop was 73% harvested, but the yield nothing close to what is being projected. In Brazil, their Soybean crop is being planted right now and it is about 20% complete according to the USDA. The USDA is still projecting a 4.269 billion bushel harvest in the US. As long as strong weekly export numbers keep coming through, price stabilization could very well be at hand. As far as cycle projections are concerned, if Beans is able to make a higher low going into November 2nd we believe that price should rally through November.
December 2016 Wheat Charts
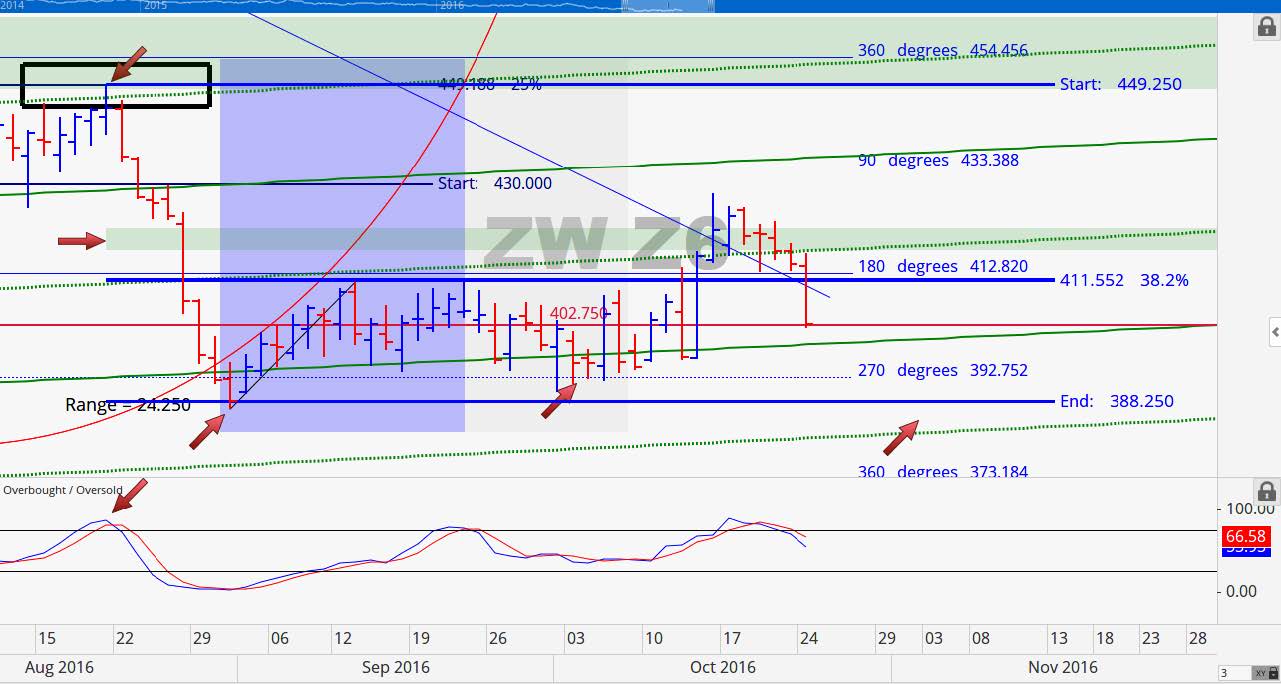
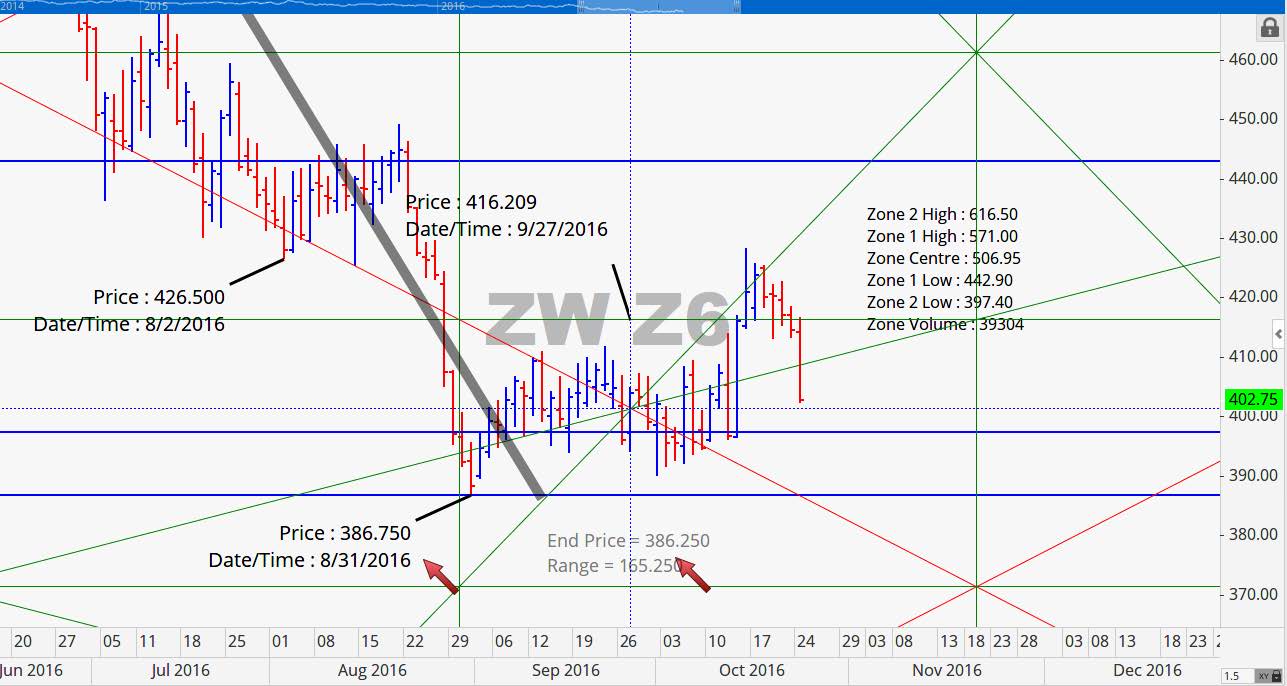
Winter Wheat is 72% planted which is essentially in line with the 5-year average and last year’s figure of 73%. We are currently looking for Wheat to decline this week, find a bottom, then advance through November. The stochastic has turned down, but if price forms a higher lower this is the perfect spot for a long entry. We like support at either 393 or 386.75.
Grain Market Overview October 11
Read more