
Trade Opportunity – High Grade Copper Futures
May 27, 2016Grain Market Overview June 1
June 1, 2016Commodity Market News May 31

Summary
On Tuesday of last week, Monsanto rejected Bayer's $62 billion hostile bid offer but agreed to hold further talks with Bayer to see if they can agree on better terms. While on the sidelines of conference in New York, the president of Monsanto - Brett Begemann was heard stating four words that might really indicate Begemann’s true sentiments - “There is nothing there”. His words were uttered to a small group on investors and a Reuters reporter when he was asked about how a Bayer acquisition would fit with Monsanto. Of note: the $62 billion bid for Monsanto is the largest all-cash corporate takeover offer on record. Both companies had initially declined to comment as to whether or not any talks were taking place but when Begemann made his comments on May 18th sources shared that Monsanto’s securities attorney was concerned that Begemann’s statements could be construed as denial that any talks were going on. The SEC disclosure rules seek to protect investors from being misled by companies. In an effort to head off any potential SEC scrutiny, Monsanto issued a statement within a few hours of Begemann’s comments acknowledging that Bayer had approached the company about the possible takeover. Bayer soon followed with its own statement acknowledging the potential transaction. The two companies will now try to carry out negotiations privately, without making further statements until there is an outcome, according to the sources.
Late in 2013, the US Department of Defense had authorized $641 million worth of cluster bombs to Saudi Arabia. At the time opponents maintained that move ran counter to a push to outlaw the use of cluster bombs around the world (aimed at reducing impact on civilian safety) while also contradicting a vote in early 2013 by both the US and Saudi governments who were critical of the use of such munitions . Both the US and Saudi Arabia had condemned the use of cluster munitions by the government of Syria but Daryl Kimball, executive director of the Arms Control Association, a watchdog group in Washington called out the authorization as inconsistent. Fast forward a few years and we find that tensions between the US and Saudi Arabia are rising. Crude Oil has mounted a historical decline over the past few years and American energy independence largely seen as viable these days. Congress has moved to allow the Saudi’s to be sued in US courts over the 9/11 terrorist incident and almost exactly three years from when it was authorized, the US is cutting off its provisions of cluster bombs to Saudi Arabia. The explanation that was offered for the move was reports of civilian casualties in Yemen.
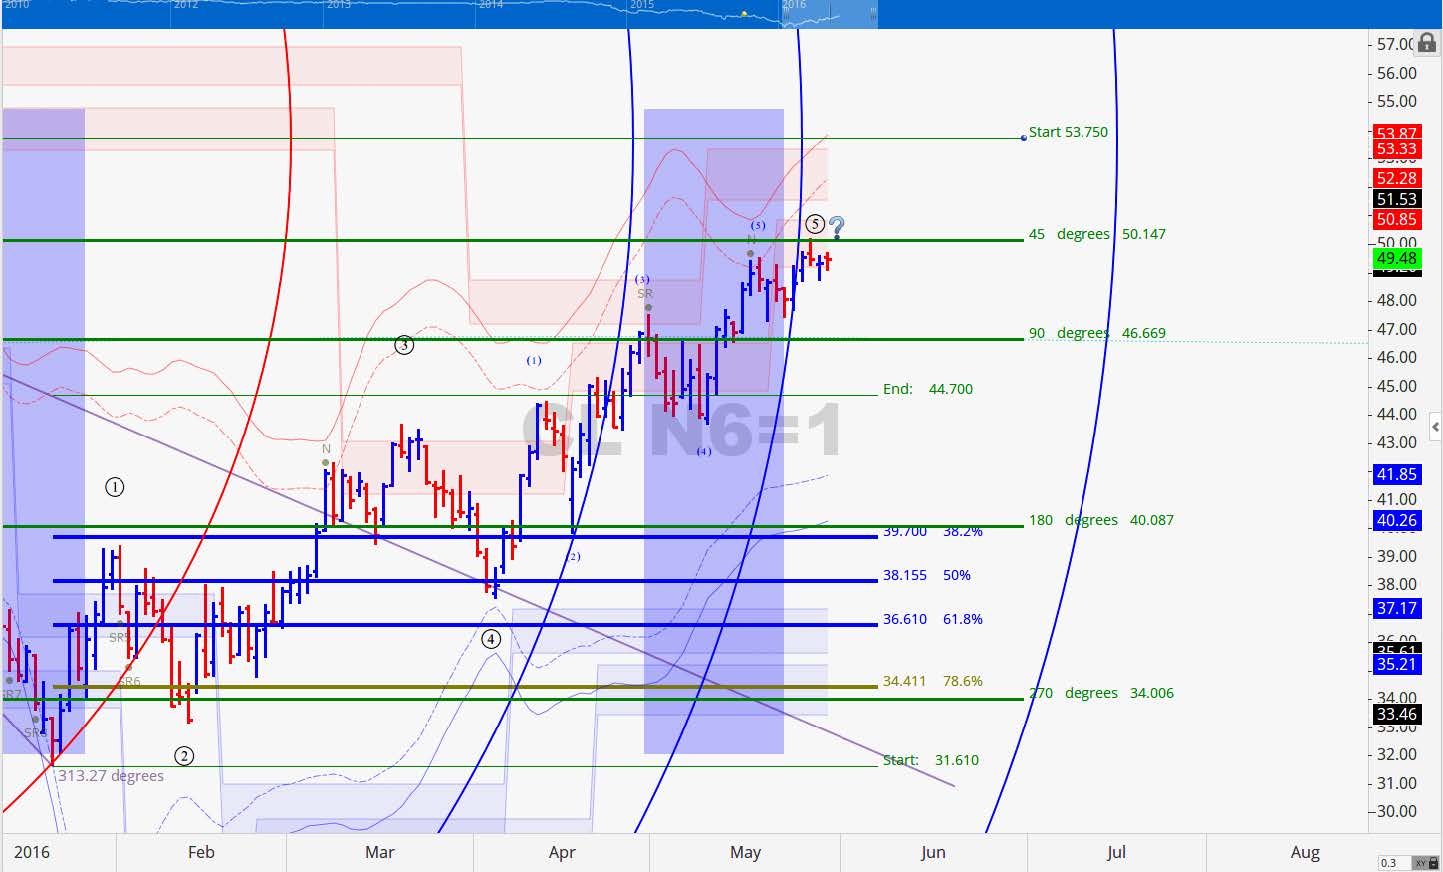
Last week on Thursday front month Crude Oil futures traded at the $50 a barrel mark for the first time since November 5th of last year. Heavy volume has been seen in the options markets last week as it has been perceived that speculators and producers were protecting themselves from potential declines from current resistance levels. The strength of this really near these prices is starting to be in question. An uptick in deep out of the money put options is signaling that producers are looking to lock in profits in the event of a potential deep correction. Prices have rallied almost 59% off of the January 20th low. Whether you are bearish or bullish, a near-term topping formation is forming on the daily technical chart that should not be ignored.
Federal Reserve Chair Janet Yellen’s recent comments that another increase in interest rates could be “appropriate” in coming months boosted support for the US Dollar on Friday and overnight on Sunday through early trading on Monday sparking a strong rally during both sessions. Crude Oil futures were a bit weaker capping off what had been otherwise a strong week for Crude Oil.
Corn
It wasn’t long ago that 400 Corn seemed out of reach but the reality is that things can change quickly in the commodity market. The question at hand these days is the sustainability of current prices and whether or not prices can move to areas that producers consider to be profitable levels. This week’s USDA weekly Crop Progress report will include its 1st crop condition ratings for this year’s domestic Corn crop. The report will be released on Tuesday instead of Monday because of the Memorial Day holiday. The numbers to keep an eye on are the amount of Corn that is in either good to excellent or poor to very poor condition. Even though initial crop ratings can move the market if they deviate far enough from expectations, the biggest market movements are seen in July, when pollination usually takes place. Outside of a weather related event crop ratings probably will not change very much for some weeks to come. July Corn was up 18.25 (4.63%) and December Corn was up 13.75 (3.44%). The planting progress is now 86% complete which is one percentage point above the 5 year average. There are not indications of problems for the Corn crop at this time and the next WASDE report is scheduled for June 10th. The July contract has diverged from cycle projections. June 8th and June 30th are the potential windows for turning points. Given the current supply narrative if a major correction is initiated in the coming weeks, a retracement that surrenders much of the recent gains would not come as a total surprise.
July 2016 Corn Charts
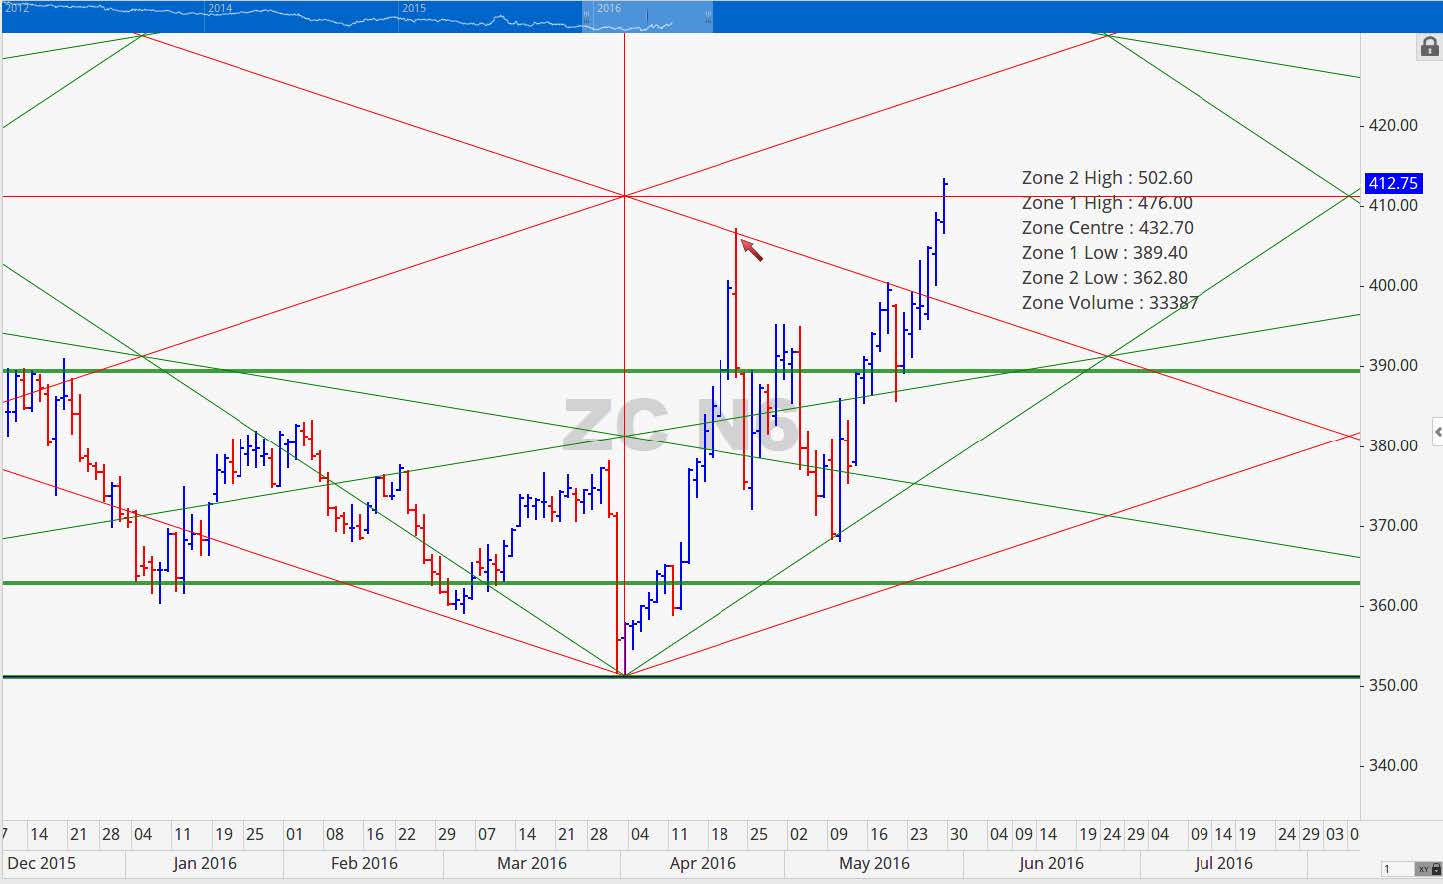
July Corn sailed through resistance at 408.50 without any issues. The close above 408.50 last week signaled a minimum price objective of 422.50 and we are looking at key resistance in the range of 429 to 433.50. This week is a shortened week because of the Memorial Day holiday. This Friday or Monday June 3rd or 6th is the next opportunity for a potential top to occur.
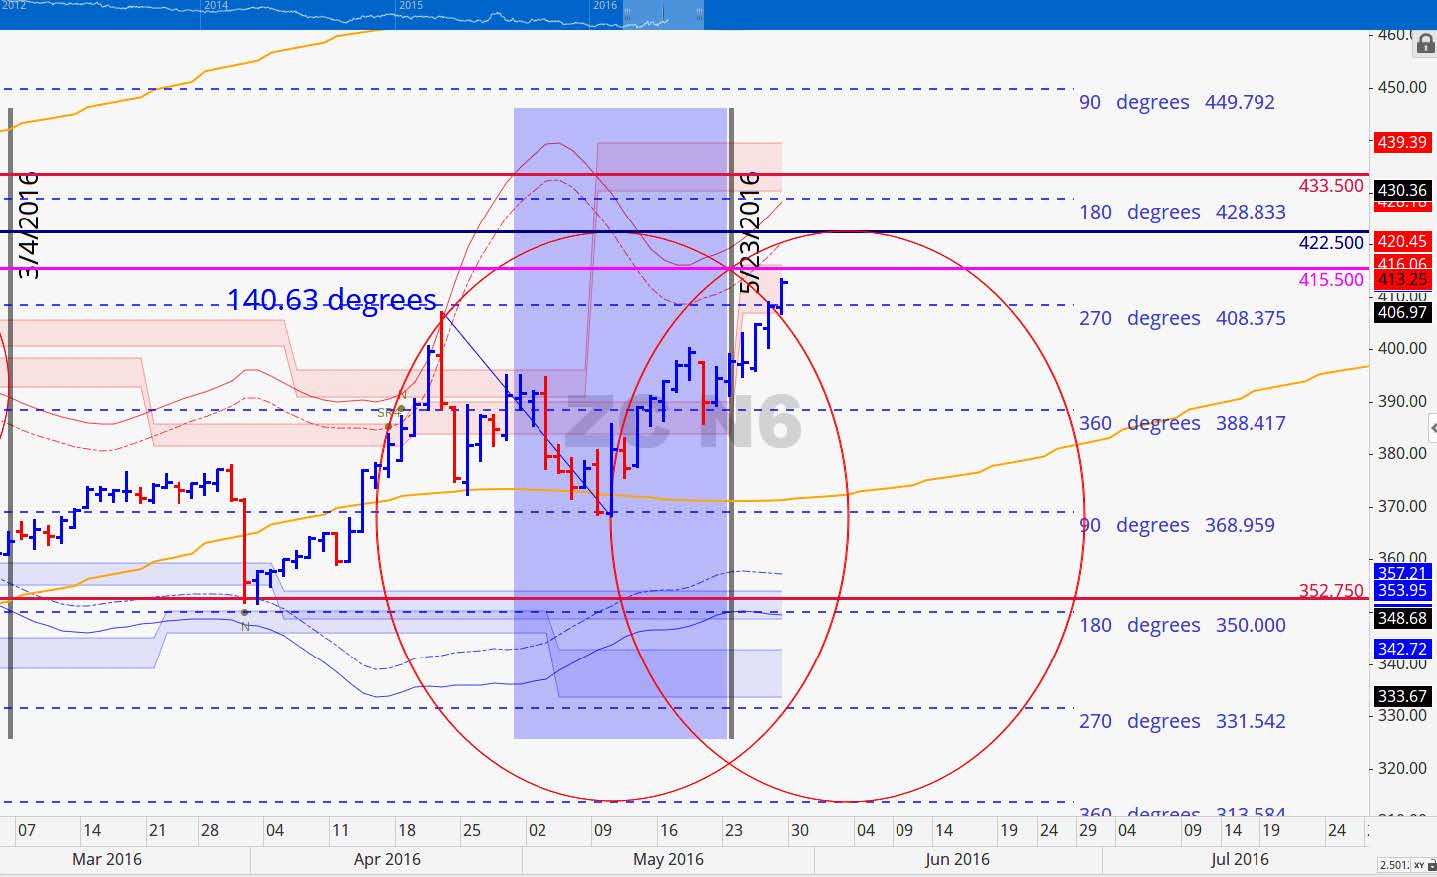
If prices were to reach either 426.25 and 426.75 on June 3rd or 6th respectively that would result in a perfect pairing of time and price along the 1 point per day natural timing angle. Overhead the point of control is 432.75 and it is at this area that we would anticipate the potential for massive resistance. Downside support now rests in the area of 388.50 to 389.50.
December 2016 Corn Charts
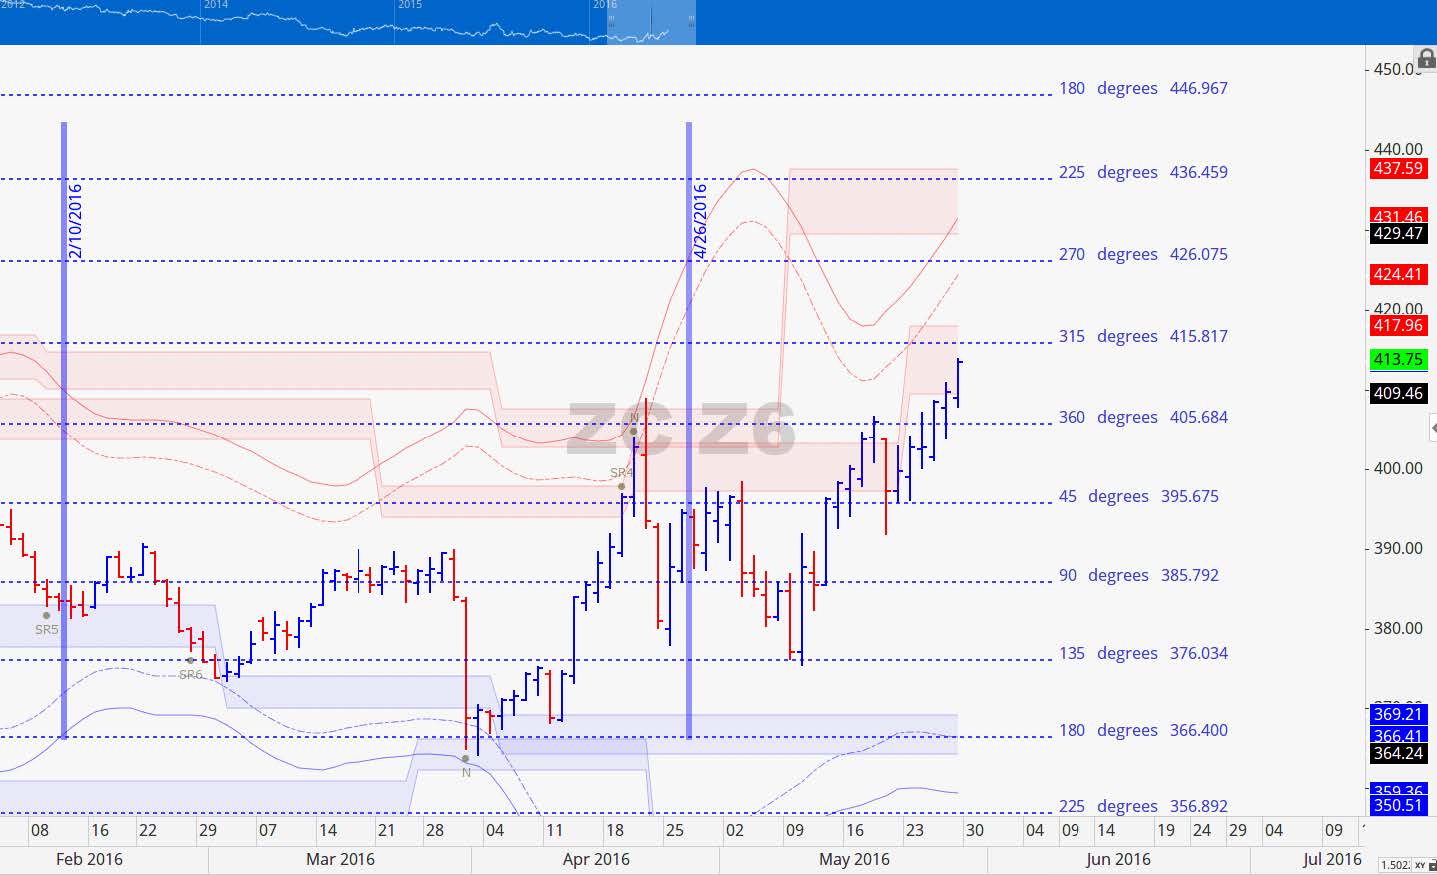
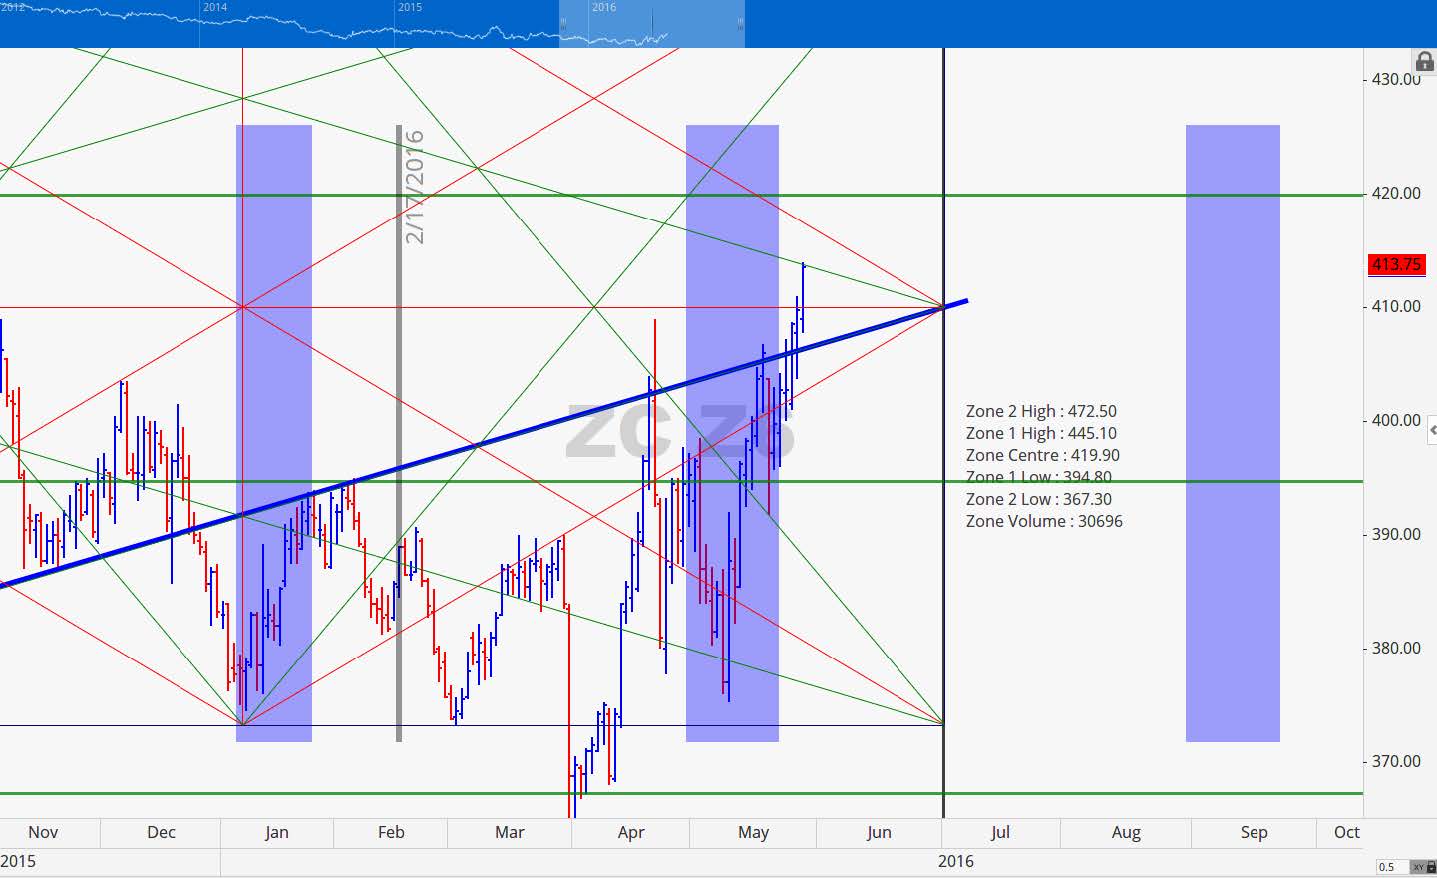
The December contract is making its way up to volatility based resistance at 418. If it is able to clear that level this week we like a minimum price target in the range of 426 to 430. Last week we shared that a close above 408 would point to a price reaching 416. Price came within 2 cents of reaching that level. We anticipate the 418 could be reached on Tuesday.
Soybeans
Gains in Soymeal futures led the way last week keeping Soybean futures in positive territory throughout for the week. July Beans finished the week up 12.25 cents (1.14%) and November Beans rallied 6.75 cents (0.64%). The Beans complex overcame a few bouts of profit taking over the course of the week. Prices struggled some on Friday but bounced back when weather forecasts pointed to coming wet conditions that had the potential to washout some fields or cause some fields to be planted late. New crop sales were not strong last week hitting their lowest levels since 2008. New crop still has some upside potential given its recent show of strength but we believe that a weather event would need to come into play. Otherwise we expect to see prices plummet as fast as it has risen. Partial new crop sales is perhaps in order. The key component of this Soybean market rally has been and continues to be support from fund managers who took in a long position at a torrid pace this spring. As long as they do not get spooked into liquidating prices may hold up a bit longer than the fundamental would suggest.
July 2016 Soybean Charts
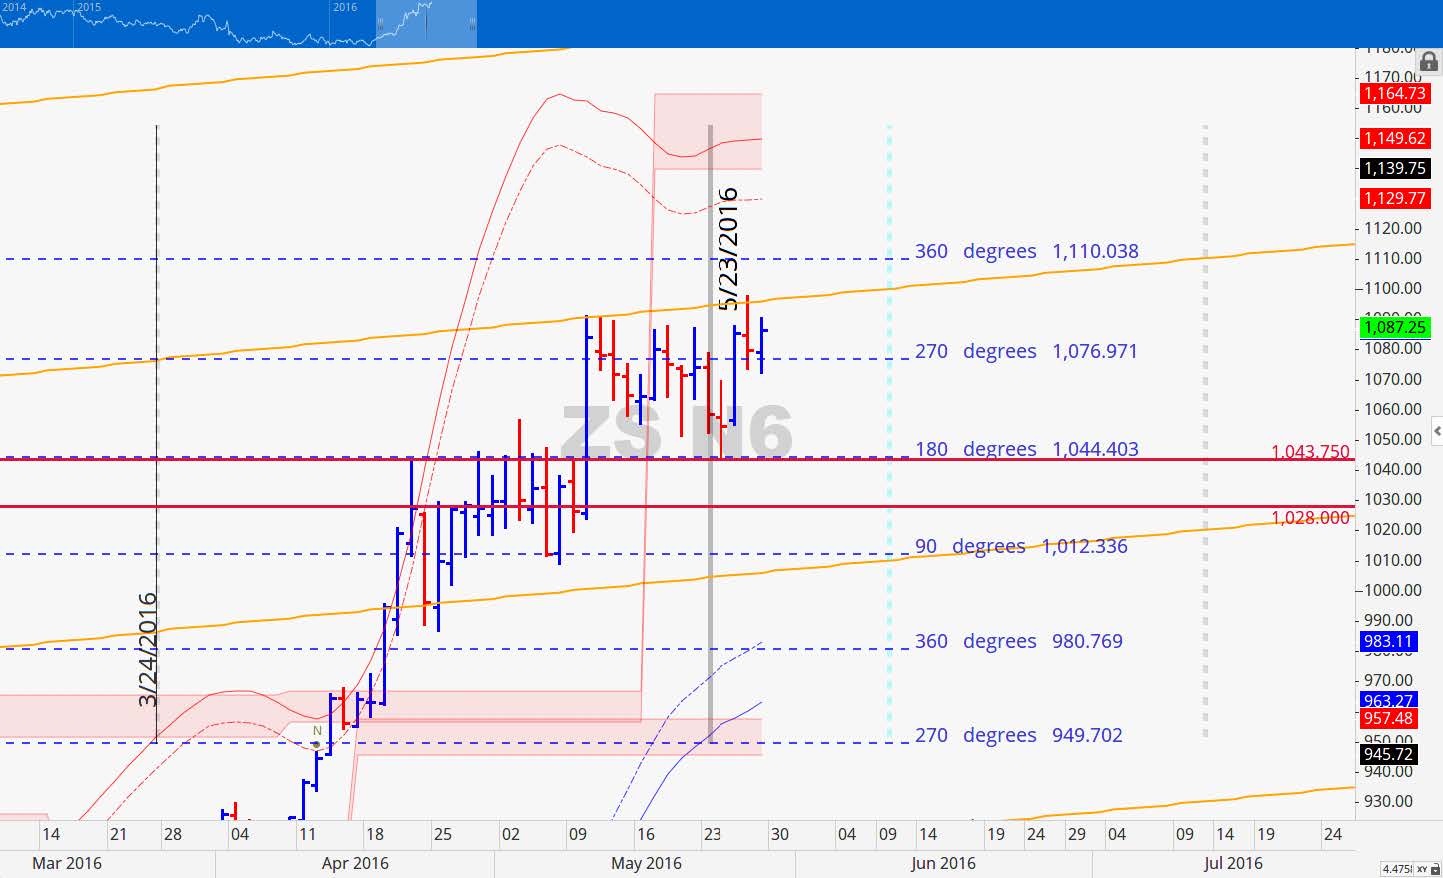
The May 23rd timeline is shaping out to be a pivot swing low. Support was at 1043.75 and resistance along the natural 0.428 price per bar scale. A close above 1097 on Tuesday would point to price reaching 1110 at a minimum this week. Additional overhead resistance is at 1140 then at 1164.75. We also have a cycle timeline of June 9-10 for a potential high to come in.
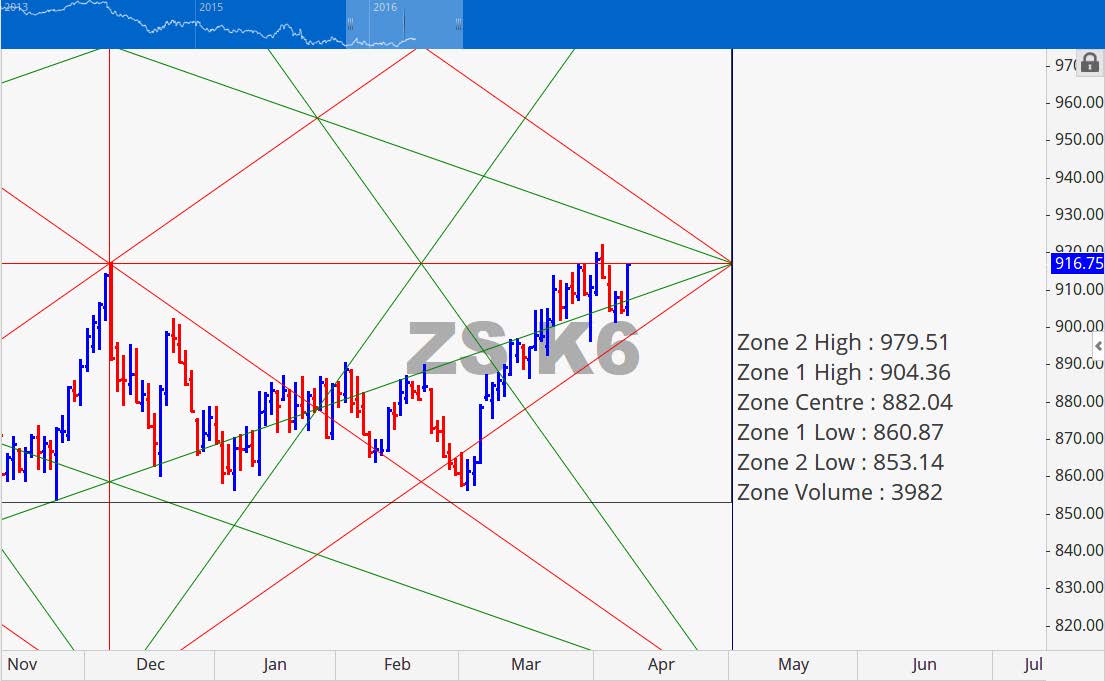
The chart at right shows the details of our point of control with it respective zones on either side of it. 904 ½ had been holding all of last week but the next area beyond it is 979 ½. The 1st line of resistance would be a 936 ¾ but if there is enough momentum we could very well see the zone 2 high price level reached.
November 2016 Soybean Charts
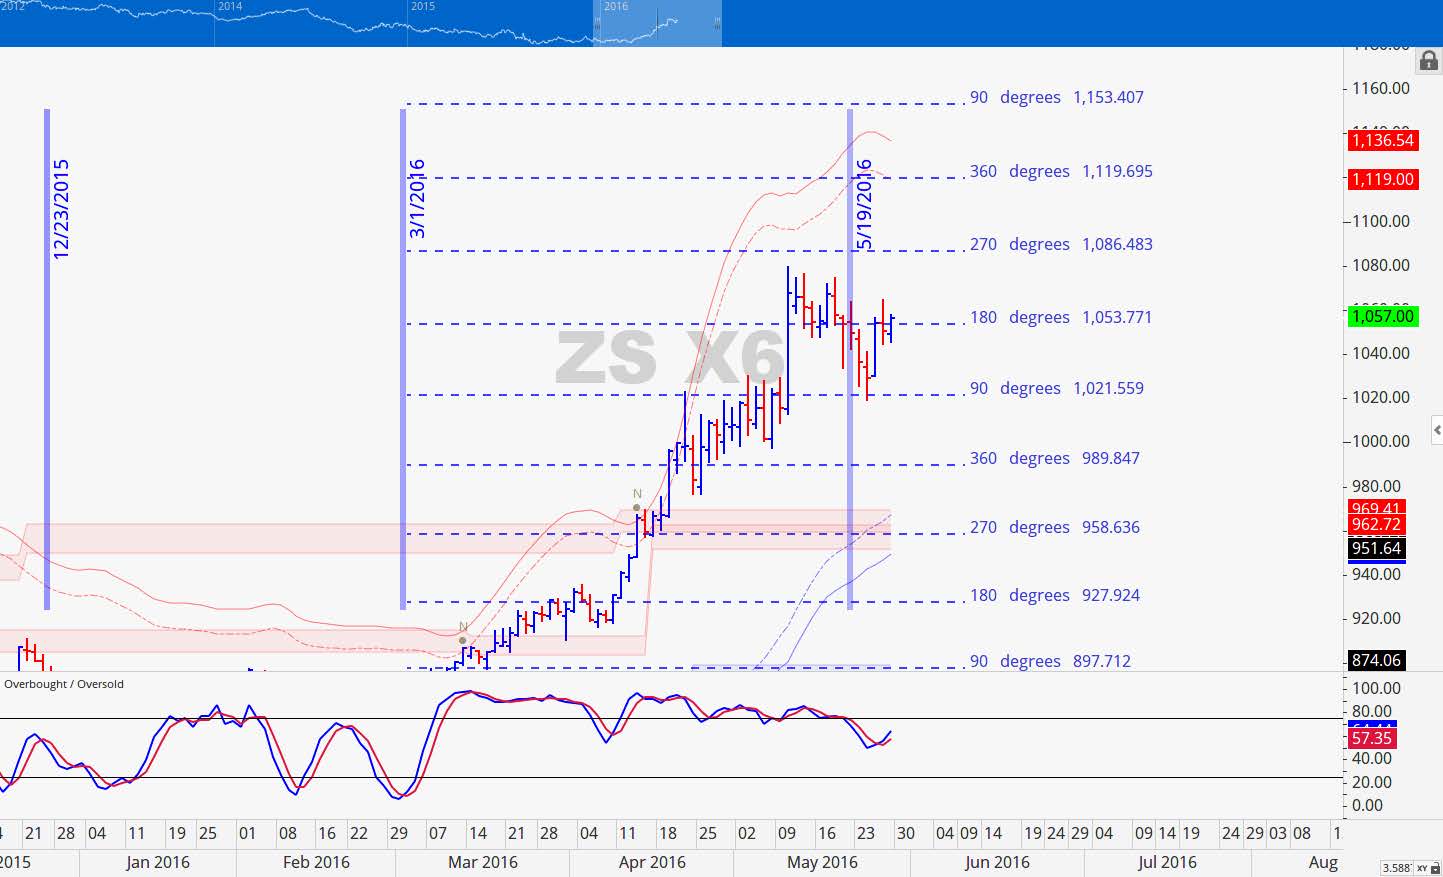
November Beans bottomed at the projected support level that we shared with you last week at 1021.50. It was able to close above the node level/180 degree mark of 1053.75 at the end of the week and could make a move to 1085.50 this week. Above 1086 key resistance would be at 1120 and we do not anticipate that price can make it much higher than 1120 but it is not wise to fight the trend.
Wheat
Just when it appears that the Wheat market was finally headed for a major plunge futures prices mounted a surprise rally and closed the week up 13.75 cents (2.94%) for the week. All of the gain for the week came at the hands of a massive rally on Thursday. Weeks like this are really gifts to producers that missed out on pricing near these levels previously. The combined Index Fund and Hedge Fund net fund ownership of Corn & Soybeans and Wheat (Chicago and Kansas City) on May 24th was $25.8 billion which was up $0.4 billion on the week and up 384% year over year. Wheat futures were the beneficiary of funds having a strong appetite for the commodity sector. Producers have been producing more Wheat than the market usages has been able to take in. Until the fundamentals change we remain cautious when rallies approach resistance.July 2016 Wheat Charts
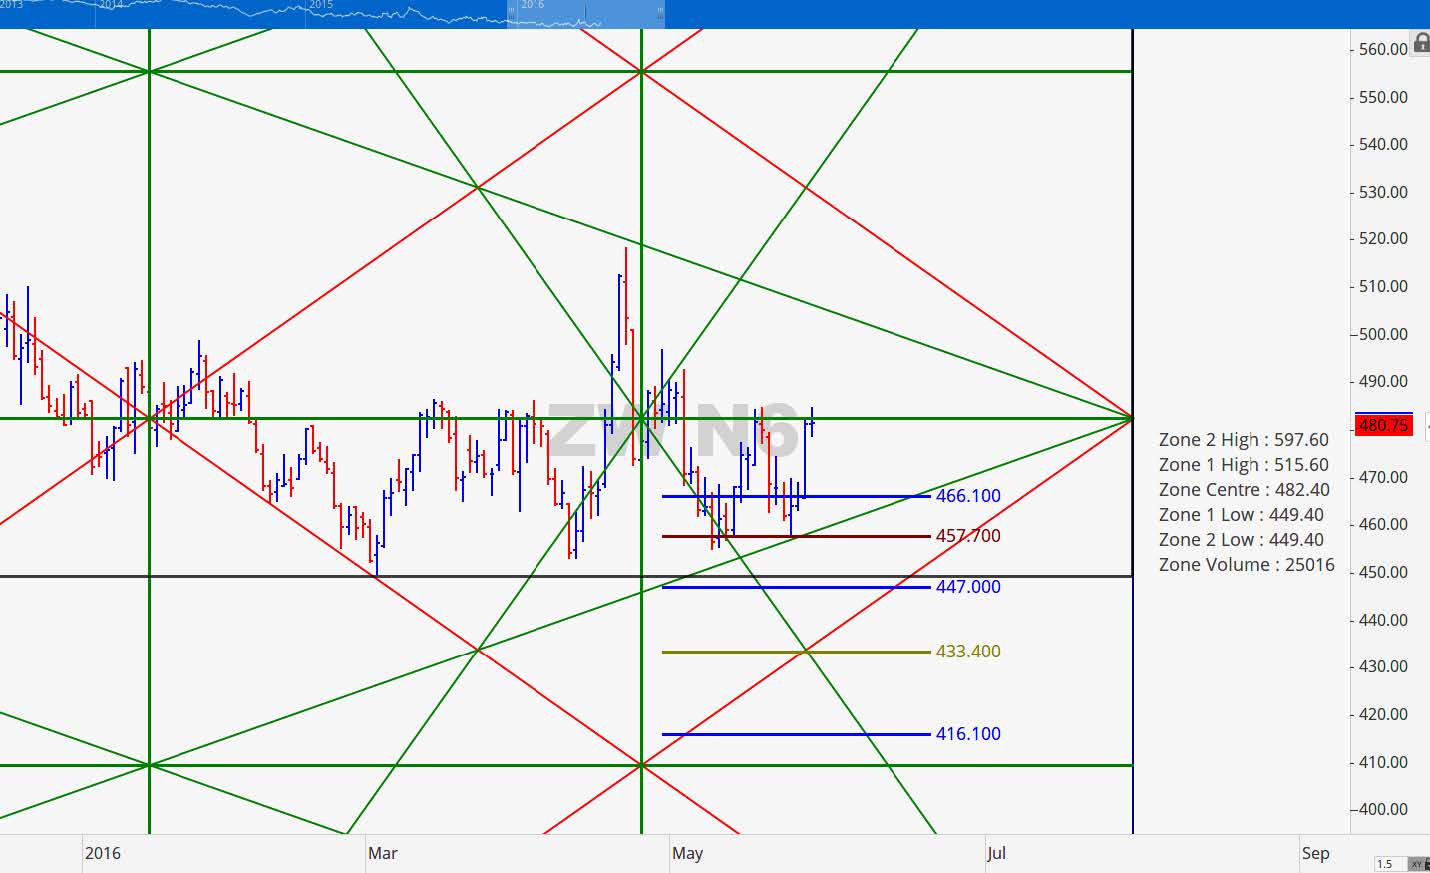
The July Wheat has now been trading in a steady range between 455 and 487. We thought that price might finally break down but the markets have other plans. Price was not able to breach the 455 mark and instead turn back up toward 487. The race is one to see which side of the trading band is broken 1st.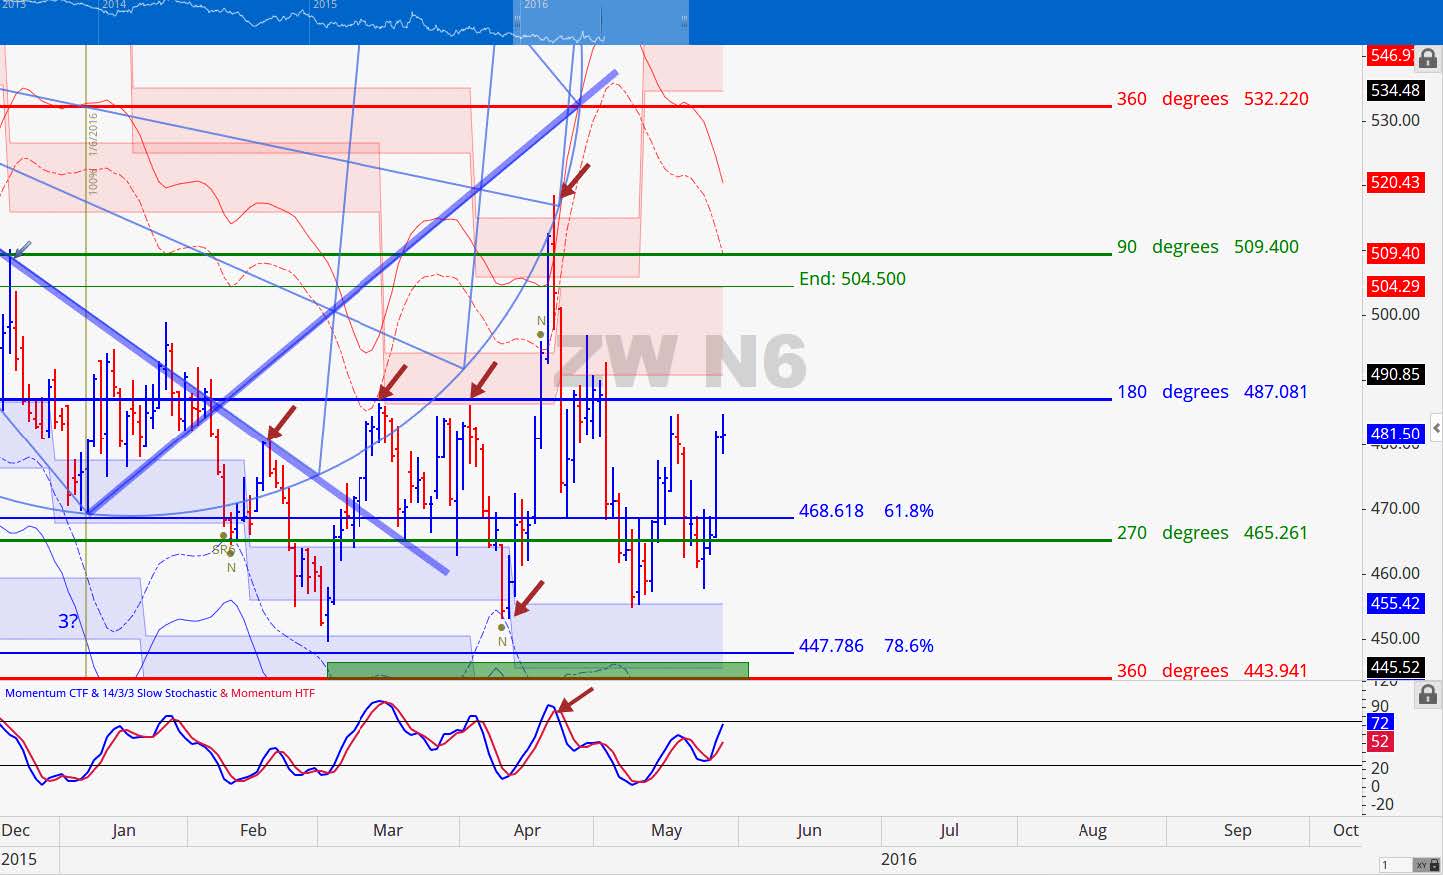
Crude Oil
July Crude gained another 0.92 (1.90%) cents per barrel last week. Posting a close above 54.50 prior to breaking 43 would signal that the bear market run is perhaps over and that Crude is poised to continue to advance or at the very least consolidate sideways. Its 1st brush at 50 on Thursday was met with some resistance as prices retreated the following day.
The Russian Energy Minister is said to potentially be meeting with the Saudi Energy Minister as well as ministers of other nations. Speculation has it that the meeting may occur around the time of the G20 meeting scheduled for June 30th.
Grain Market Overview October 11
Read more