
Grain Market Overview May 18
May 18, 2016Grain Market Overview May 25
May 25, 2016Commodity Market News May 23

Summary
The company name that draws the ire of almost every anti-GMO entity on the planet could be going away. Bayer, German drug and chemical powerhouse, has put in a hostile bid to buy the US seed company Monsanto reportedly for $62 billion in cash. It has only been three weeks since Werner Baumann took over as CEO for Bayer and this move to take over Monsanto is not being received well by shareholders. A major shareholder has gone on record calling the effort "arrogant empire-building" when news of the proposal emerged. If the merger goes through Bayer would grab hold of the number one spot for the farm supplies industry. Monsanto confirmed last week that it did receive an offer but gave no details or comments beyond acknowledging receipt of the offer. Monsanto's share price jumped almost 10% in pre-market trading.
Another major agricultural company made headlines last week but its share prices moved in the opposite direction. The Illinois-based machinery and agricultural equipment manufacturer John Deere fell prey to the low commodity prices that has plagued the industry for quite some time. Stagnant farm and producer income has caused producers to tighten the reign on capital expenditures. Their tightened expenditures are the main reason cited by Deere. Deere share prices dropped over 5% when the earnings were released on Friday last week. The Deere earning report also highlighted not only domestic but global weakness as well. Their outlook for the next quarter was tapered by what is perceived as continuing impact of the global farm economy downturn.
The Summer Olympics in Brazil are set to transpire while suspended President Dilma Rousseff is still on trial for breaking budget rules according to local government sources. The interim government's efforts to fast-track the process will not be enough to bring the trial to an end before the Games. Heads of state attending the opening ceremony who were invited by Rousseff will instead be shaking hands with Interim President Michel Temer. Temer, a close presidential advisor to Rousseff, took power last week after the Senate voted to put Rousseff on trial.
The Federal Reserve has been doing its best to veil its intentions for the upcoming June FOMC meeting. Some market players are starting to question the recent signals that the Fed has been sending. They really don't want people to assume there will never be a rate hike. For them to communicate that the chances of a rate hike is a long way off would be full admission as to how bad off the economy really is. On the flip side the intervention on the part of the Fed continues to artificially keep rates low and artificially prop up the equity markets. It is in their interest to keep the threat of a rate hike occurring at any time alive. Additionally, the Fed probably does not want the US dollar to rise which would be the likely result of a rate increase. In fact the US dollar has been steadily rising since bottoming on May 4th. Long term strength in the US dollar would inherently translate into weakness in grain markets.
Corn
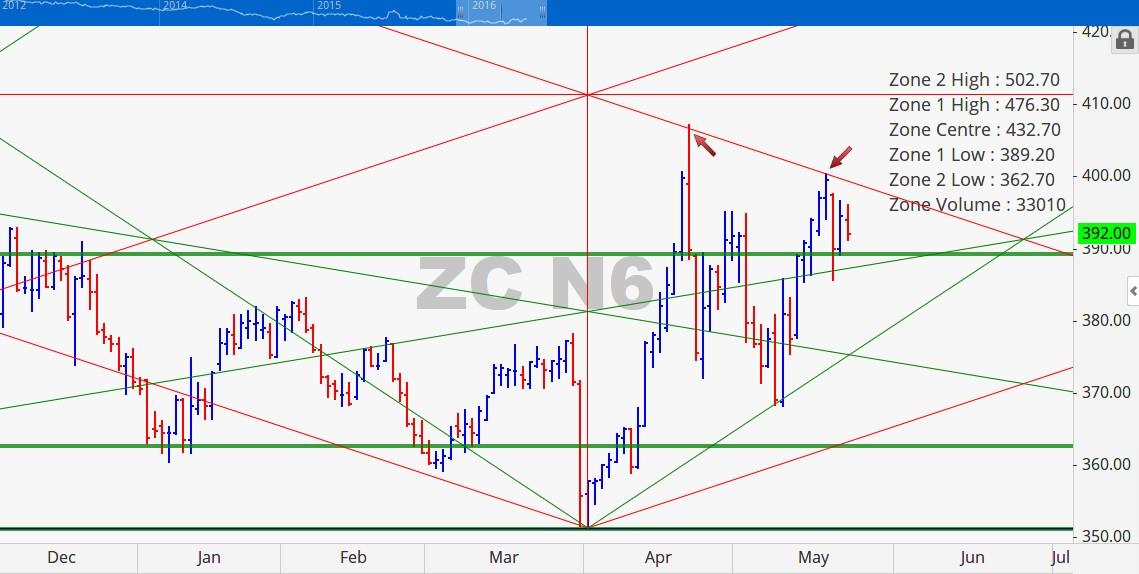
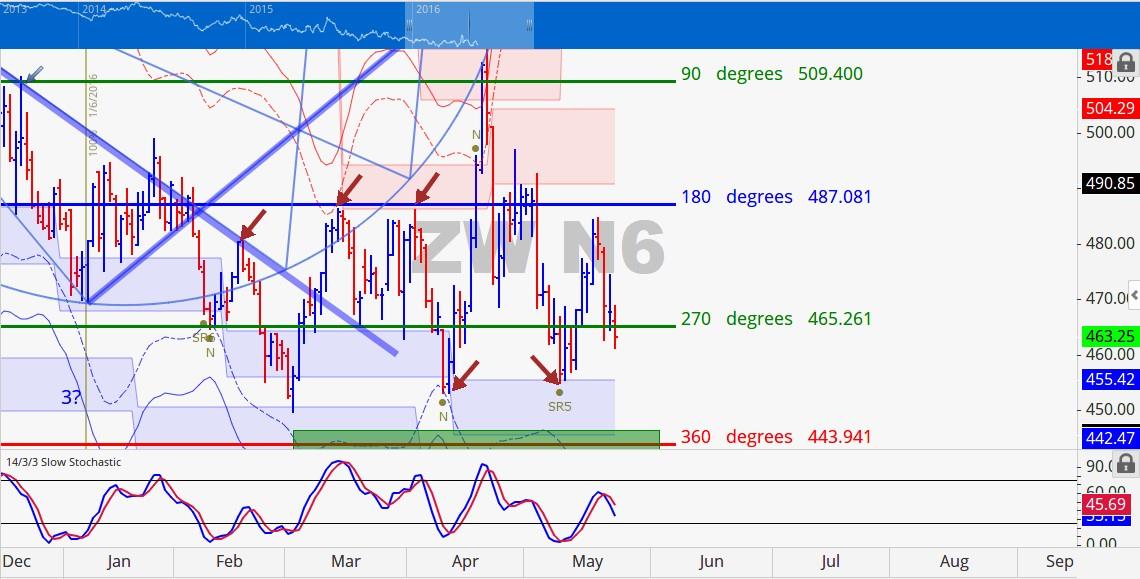
Last week both July Corn & Soybeans rallied just shy of 1%. The July Corn contract rose 3.75 cents (0.96%) and December Corn was pretty much flat rising 1.50 cents (0.38%). On their weekly charts Corn futures are approaching being oversold by way of the stochastic indicator which is consistent with a potential topping formation that tends to occur. Market cycles would project a drift into the end of the month followed by a lower high in early June. Instead we have been moving up from the May 10th low. If Corn tops at the end of this week then we may have an inversion of the price cycle. The high that was made on April 21st is a key level of resistance to keep on your radar.
Corn sales numbers were once again strong. The estimates for the 2015-16 marketing year ranged from 900k to 1300K metric tons and the 2016-17 marketing year estimates were at 100k to 300k metric tons. The final number for both marketing years was well surpassed at 1473k and 540.7K metric tons respectively. Old crop sales were the 3rd highest recorded for the marketing year and new crop sales hit it's highest number of the marketing year. Total commitments currently rest at 92% of the USDA's export total.
July 2016 Corn Charts
Price broke through resistance at 388.50 and the next key level is 408.50. We are at the end of our cycle timeline and the potential for a big move in the next day or so is possible. If price is not able to close above 408.50 this week we believe that the high made on April 21st will stand for at least 3-4 week. On Wednesday of last week price managed to touch 400.50 closing at 399.50.
This week's price movement is critical to giving us insight into the coming weeks.
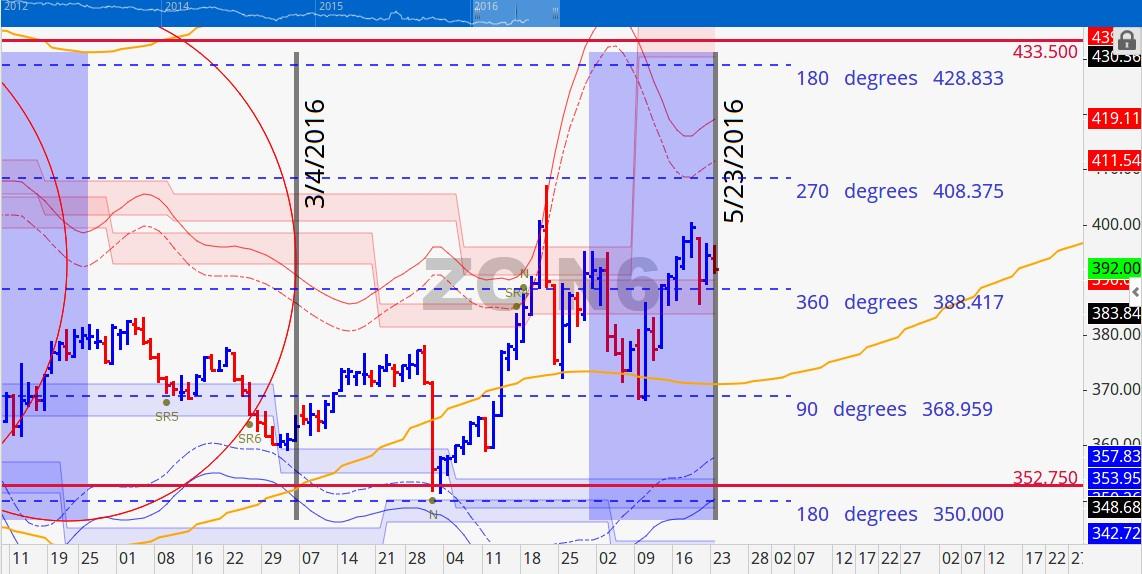
In the chart at right, you will notice how the natural support/resistance angle continues to effectively pinpoint potential top and bottoms. Last week's top stopped right on the 1 x 1 sloping angle. This week, closing below 389 would point to continued weakness to come. One standard deviation below the point of control is 389.25.
December 2016 Corn Charts
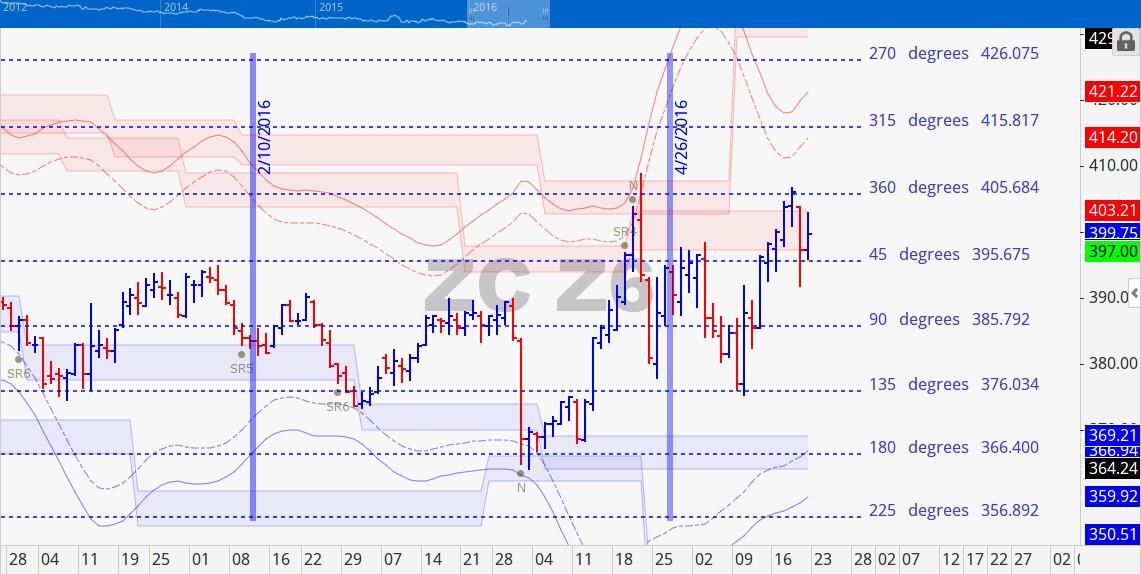
The December contract stopped at the cycle terminal level of 360 degrees (405.75). The last time this price level was touched we saw strong resistance and we are not surprised to see price react to this level again. A close above 408 should send price to 416, a close below 395.50 should send prices to 386. As mentioned previously this week looks to be pivotal especially since we are approaching a long Memorial Day weekend.
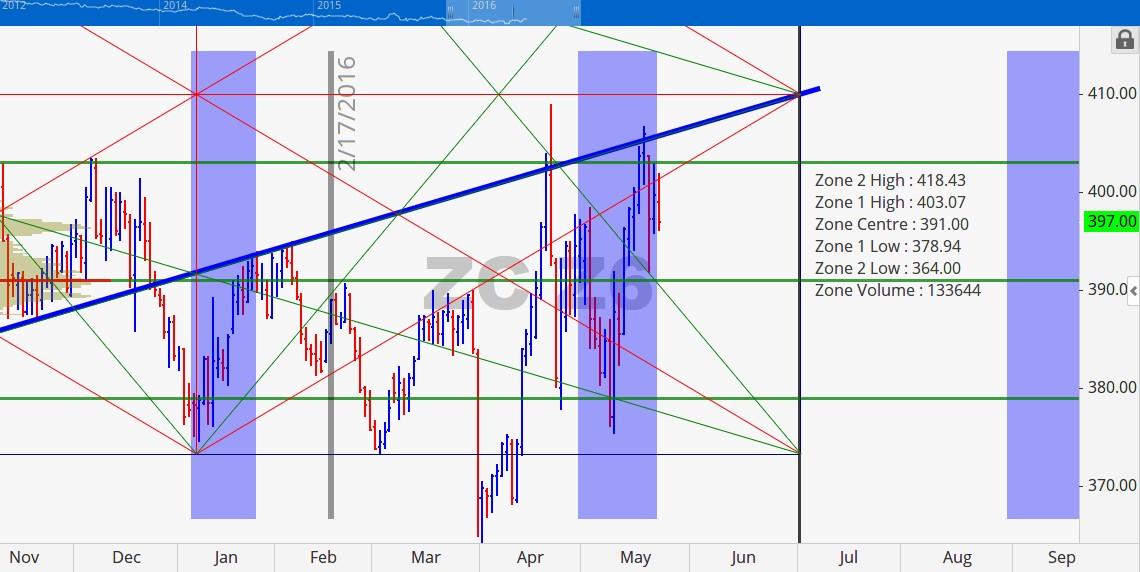
The point of control for the December contract is still at 391. Overhead resistance and downside support that we shared with you last week were pretty much the high and low of the week (403.25 and 379). This week those levels are little changed at 403 and 379. Once again these are the key levels that we should look to for direction this week.
Soybeans
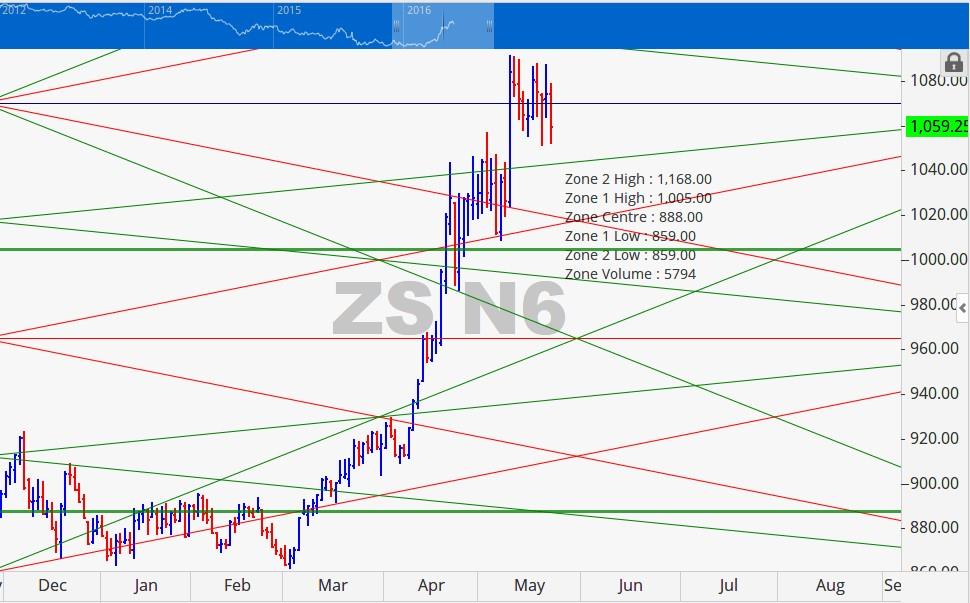
July Soybean futures rose 9.25 cents (0.87%) but November Beans diverged dropping 5 cents (0.47%) on the week. The planting progress continues to be ahead of schedule. Last week we shared that we believed that 1100 would pose as significant resistance for the Soybean complex. The November contracted topped at 1079.75 and the July contract topped at 1091.50. We have been looking for Beans to top in June but it reached our key resistance levels a bit early. That means that a drop in prices for the rest of this month could result in a lower high in June instead of a slightly higher high. If fund managers start to liquidate or reduce their net long positions a volatile drop could happen in short notice.
Soybean export sales figures were strong for the old crop but weak for the new crop. Estimates for the 2015-16 marketing year ranged from 300k to 500K metric tons and the 2016-17 marketing year estimates ranged from 50k to 250k metric tons. Old crop came in at 556.4K metric tons and the new crop was at 158.3k metric tons. Current prices are testing the highs made in the early part of the month.
July 2016 Soybean Charts
July Beans has finally met our May 23rd timeline and it could end up signaling the end of what has been a range bound price action for the last 2-3 weeks. Key resistance at 1077 and 1100 has been strong and if we close below 1043 early in the week we anticipate that prices could continue lower for the balance of the week.
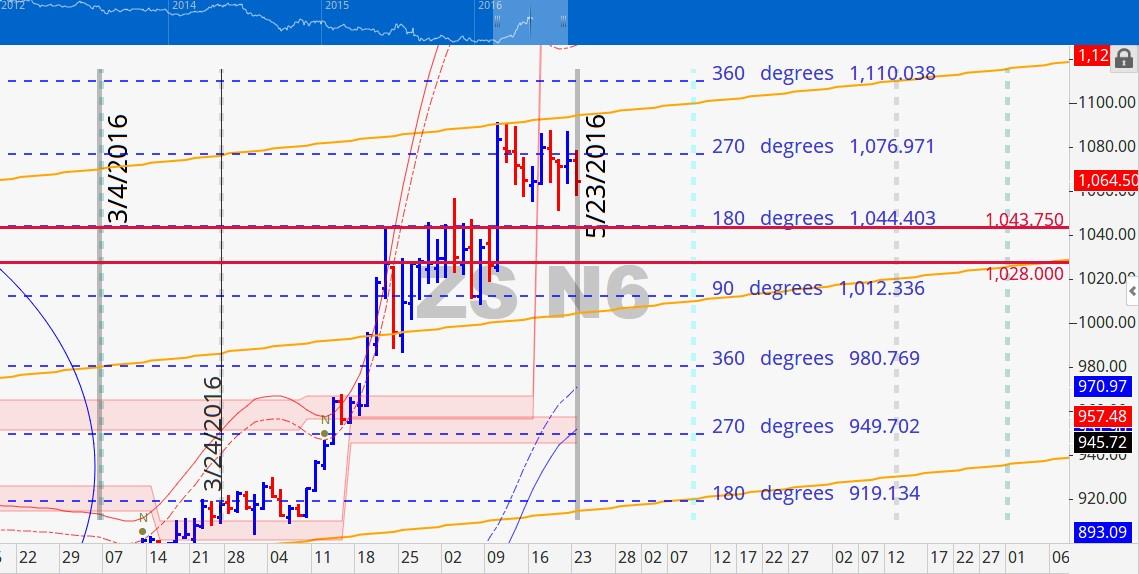
Two standard deviations above the point of control last week was 1075. Prices churned so much last week near that level it caused it to rise to 1168 this week. We believe that this spot will be quite the extreme for this contract. The next level below is 1005 and this is perhaps a good target support level for this week. Breaking below would stand to put fund managers on notice.
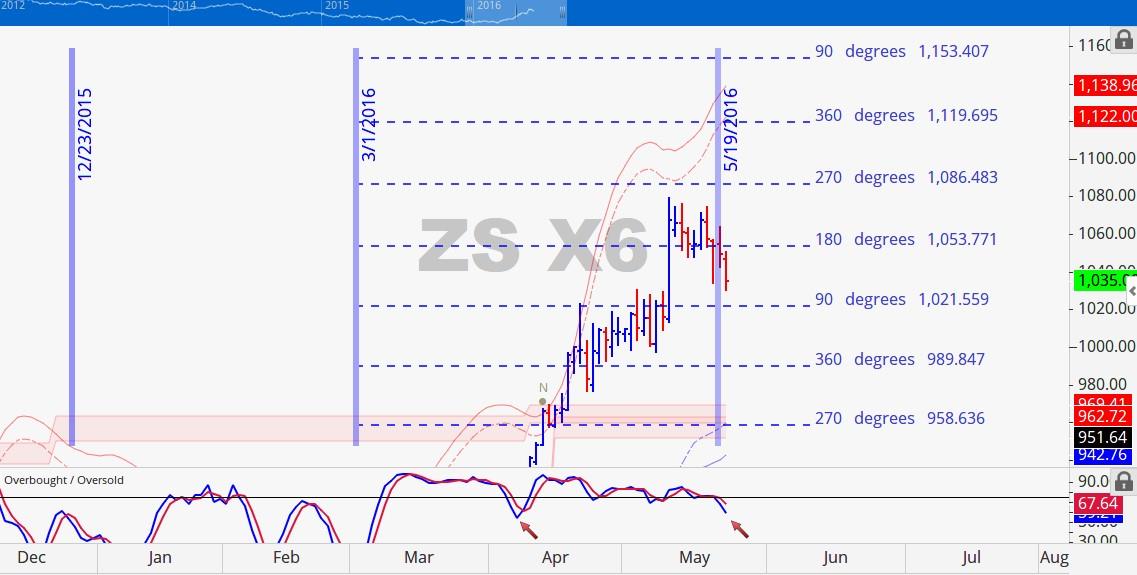
November 2016 Soybean Charts
As anticipated, the breakout move to the upside was not sustainable and prices continued to move down from there. Overhead resistance at 1086.50 was not violated all week. In fact it had trouble just holding support at the 180 degree mark of 1053.75. Below 1053.75 the next price support level rests at 1021.50. We got close to that level on Thursday last week and again today. With continued weakness reaching 990 in the short term is not out of line.
Wheat
July Wheat was down 7 cents (1.47%) on the week and has been moving consistent with expectations. Argentina plans to plant the most Wheat seen in almost a decade. The estimate of 5.3 million hectares for next year is almost a million higher than this year's 4.37 million. Private analysts' are estimating the US Wheat crop for next marketing year to be 60.9 million tons. That would be over 6 million above the USDA estimate of 54.37 million tons. The low made on May 9th is a minimum price objective but it could very well go lower.
Last week, Wheat exports were in line with expectations for old crop and very strong for new crop. The Old crop figure of 175.2K metric tons with estimates at 0-250k metric tons. The top end of the new crop expectations was 400K metric tons and the actual number was 573.5k metric tons.
Grain Market Overview October 11
Read more