
Grain Market Overview April 27
April 27, 2016Grain Market Overview May 4
May 4, 2016Commodity Market News May 2

Summary
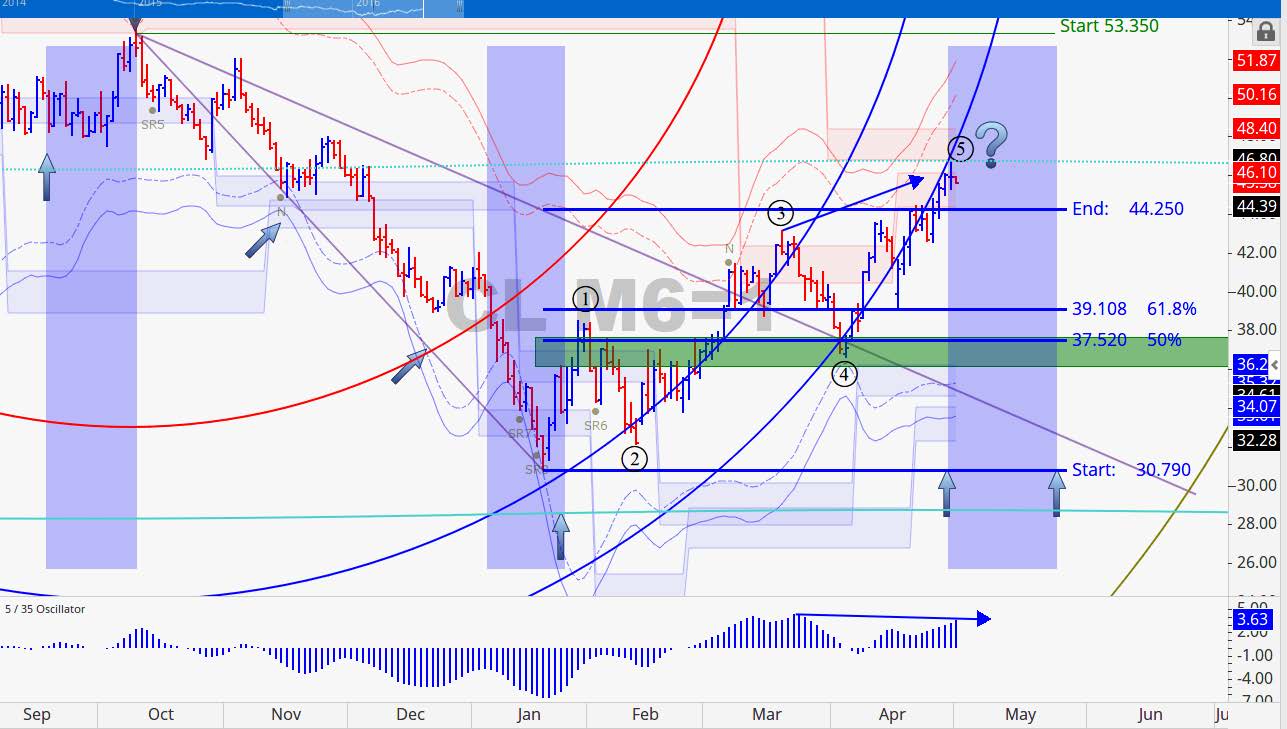
Just as grain producers have been taking advantage of the rally in the agricultural markets these past two weeks, US Crude Oil producers have been hedging future production at current price levels in the event that April’s rally is only a correction in what has been a sustained bearish downtrend. Evidence suggests that when markets reach octaves or 8th divisions of a natural cycle, such as 360 divided by 8 being 45, prices tend to respond to those levels as natural support or resistance. The June Crude Oil futures contract made it’s high of the week on Friday last week at 46.78 closing at 45.92. If prices are able to hold above the 45 mark and it’s up through 50 major producers could turn their sites toward adding rigs. Last week, Pioneer Natural Resources Company indicated it would add rigs with Crude Oil above 50 per barrel. According to the Baker Hughes Rig Count report, US Oil drillers took another 11 rigs offline bringing the number of North American rigs that were shut down last week up to 14. The US rig count currently sits at 420 and the North American total is at 457 which is well below both last year’s and the 5 year average.
Speaking of rig counts, the oilfield services giants Halliburton and Baker Hughes have cancelled merger negotiations amidst opposition from the current president’s administration. The Texas companies initially sought to "vigorously contest" the US Department of Justice's lawsuit against Halliburton's acquisition of Baker Hughes but the obstacles appear to have been more daunting than anticipated. Halliburton will pay Baker Hughes a $3.5 billion breakup fee to compensate for the deal's collapse.
The investment community is wanting to believe that a major low in the commodity markets has occurred and they are looking to the Bloomberg Commodity Index as potential confirmation. The Bloomberg Commodity Index measures the returns for 22 components. Last month in April it advanced 8.5% eclipsing the returns of the global equities indices, high-yield bonds, investment grade bonds, treasuries and all major currencies. Two of the components in the Bloomberg Commodity Index responsible for much of its recent returns are Gold and Crude Oil. Gold recently reached levels last seen in January of last year. Meanwhile, Crude Oil has been on a tear since January 20th of this year breaking 4 month highs as of last week. The US Dollar has been steadily declining after the Fed failed to raise rates as they indicated that they might leading into the December 2015 meeting. It topped on December 2nd followed by a sharp drop. It traded sideways through January where it made another sharp decline and has been trending down since.
After suffering through weeks of dry and hot weather in central Brazil, a strong cold front swept into Brazil last week bringing with it much needed precipitation and the coldest temperatures of the year. Widespread frosts and freezing temperatures were recorded across the region and even some snow in the higher elevations. Alas, the rainfall may have helped to stabilize the Safrinha Corn crop temporarily, but generally the rainfall was not heavy enough to maintain the crop from further deterioration, let alone reverse any of the damage already done to the crop. Current reports are suggesting the 2015-16 Brazilian Safrinha Corn crop could come in as much as 5-10 million tons below initial estimates. Faced with the supply shortages, with import taxes lifted Brazil is reported purchased Corn from the US for the 1st time in 20 years.
Weather related interruptions and weather scares in South America have clearly been a factor in the recent support in Agricultural prices but the supply still remains strong in the US. The weeks ahead look to bring additional clarity to the landscape.
Investors have taken notice of the strength in the commodity funds and last week the Wall street journal reported that commodity funds brought in more capital during the 1st quarter of 2106 than any other type of hedge fund. In fact the commodity funds group saw an inflow of $4 billion. That is the largest inflow for any quarter over the last six years. Over the last seven consecutive months, the commodity space has brought in more money that it has had to redeem setting the longest winning streak on record.
Corn
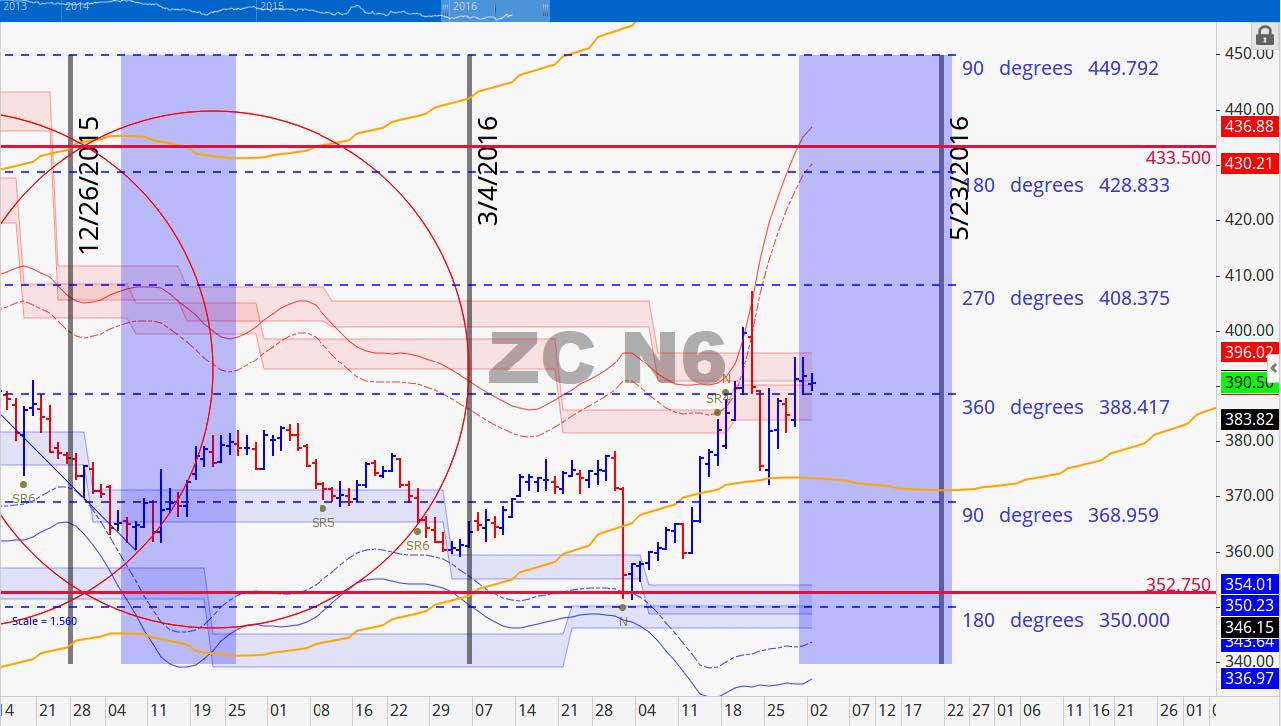
We have rolled from the May contract to the July Corn contract. The US planting progress was reported at 30% complete outpacing the 5 year average of 16%. The US Corn planting is on pace to reach the 50% mark by the end of the week and is running about 1-2 weeks ahead. Export sales for Corn were the strongest for the marketing year to date coming in at a massive 2.161 million tons for just the old crop. The new crop sales added an additional 440k tons. The export number for Corn this past week was primarily very high because of the falling US Dollar. Keep in mind that the estimated acres being planted for Corn is still listed as 93.6 million. If this much acreage is in fact planted, it will be an all-time record! The commitment of traders report showed that speculators are continuing to buy Corn buying up 280,000 contracts over the past 3 weeks. Specs have officially moved being net short to having a net long position. During transitional net long versus net short changes that markets will sometimes show a change in trend on the chart price action. July Corn moved up 16.25 cents 4.33%) last week and December Corn gained 14.25 cent (3.74%). We are looking for the recent Corn rally to pause here soon and make a top that declines into the May 23rd cycle projection down to the 360 to 365 range.June 2016 Corn Charts
July Corn transitioned through resistance at 388.50 and has its next two levels of resistance at 396 and 408.50. We anticipate that this contract will have trouble getting beyond 400. The decline from the high on April 21st lasted 2-3 days but we are 5-6 days from that low and it has managed to only recover 62% of that drop. Volume has been steadily declining in conjunction with the lack luster advance suggesting that prices may have a tough time hold up. Over the next day or so we are entering a potential cycle turn period. We would not be surprised to see a downward to sideways move into the third week of the month.
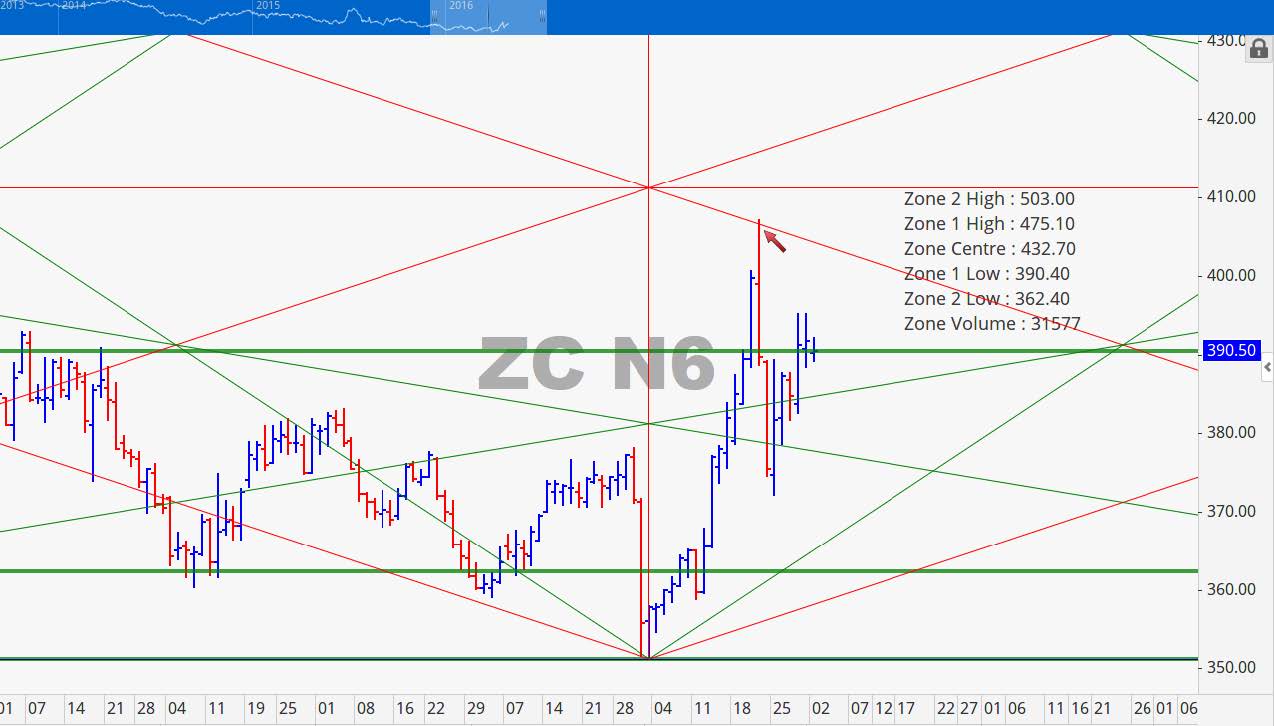
Our point of control level for this contract is at 432.75. This is well above the current price action but the one standard deviation levels below appear to be right on point. Both 390.50 and 362.50 are key levels. If this contract closed below 390.50 this week we believe a minimum price objective of 362.50 is probable.
December 2016 Corn Charts
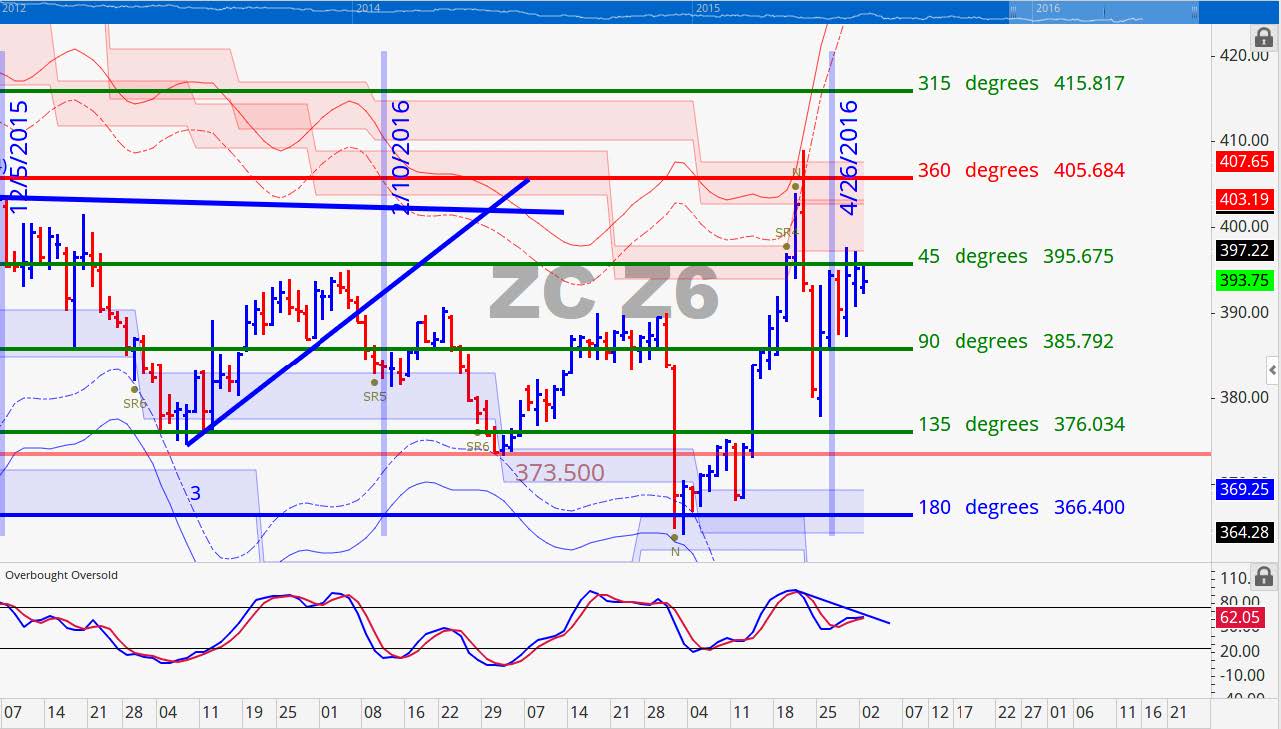
The December Corn contract moved up into the April 26th timeline and it looks like it might want to decline on the other side of it. Resistance at 395.75 looks to hold today and a brake or close below 385.75 this week would be significant. We are looking at a downside target of 376 for this contract.
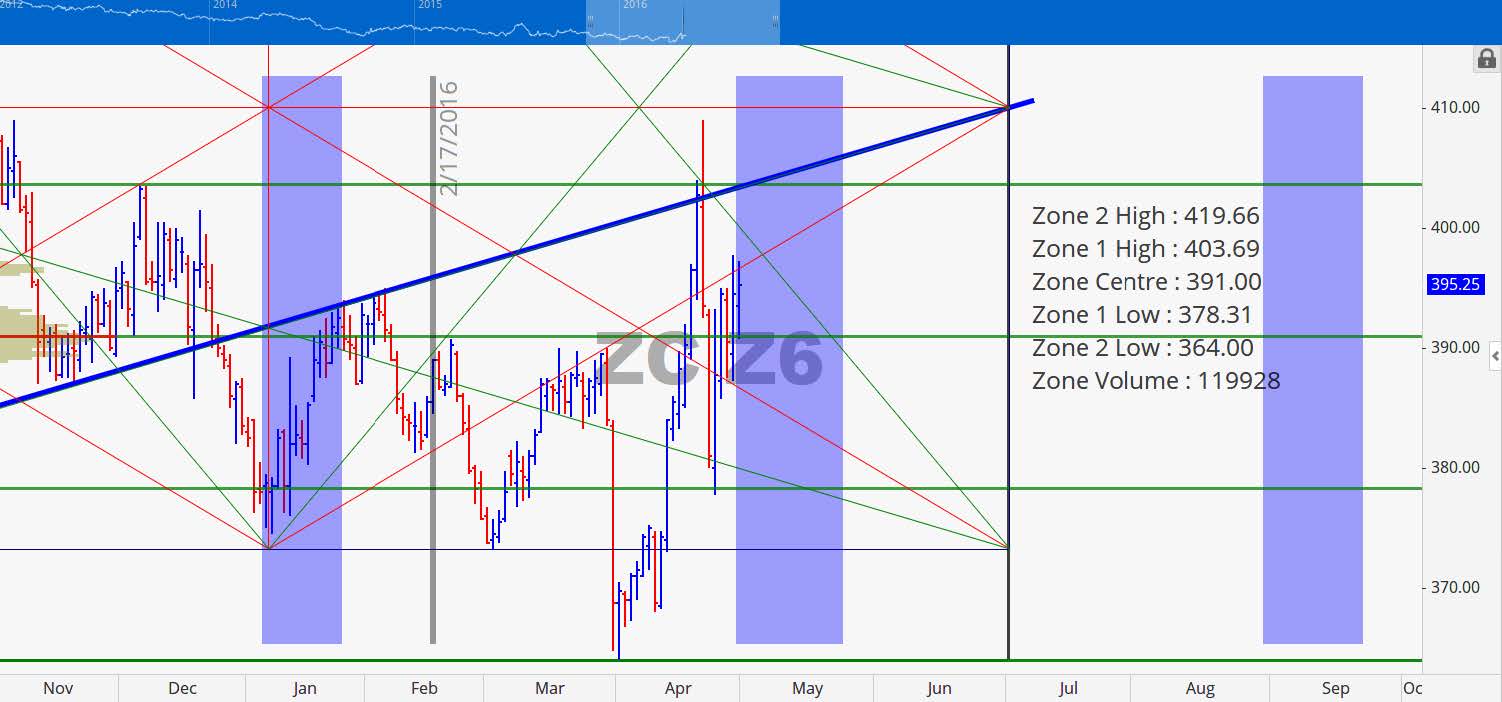
As last week the point of control remains at 391 with 1 standard deviation on either side measuring at 403.75 and 378.25. Early in the week if price closes above the point of control we would look for price to test 403.75 and below for it to test 378.25. The natural overhead resistance red trend line suggests that prices will be under pressure today. In the event that prices close below 378 this week look for a fast move to 364.
Soybeans
Like Corn were have rolled over to the July contract away from the May contract. Argentina has not been able to ascertain the extent of damage from the flooding rains they received. With fields submerged in standing water producers have not been able to access how much production has been destroyed. Weekly export sales data for Soybeans was nothing to write home about. Old crop sales were on the weak side with the new crop sales coming in pretty good. The combination of the two made for an average reporting. The commitment of traders report continues to show that speculators appetite to increase their net long position is strong as they bought another 27,000 contracts last week. Their net long is now sitting at 146,000 contracts. The short positions held by managed money fell 4.1%, the lowest level since April 29, 2014. Money managers currently hold 22.5% of all Soybean long positions which is the highest since July 01, 2014. Additionally, the number of registered money managers currently holding long positions is 118, which is the highest number since September 11, 2012. The rally in Soybean started when the planting estimate set the acres planted as 82.2 million, which was less than expected. The Soybean planting is now listed as 3% complete since the planting just started last week. If money managers are on the wrong side of this trade we will see a violent reaction. All of this overture might make for softer prices early in the week. Last week July Beans rose 33.50 cents (3.36%) and November Beans increased 24.75 cents (2.52%). We are looking for price to start forming a near-term topping formation over the next week or two at resistance followed by a decline into mid to late May.
July 2016 Soybean Charts
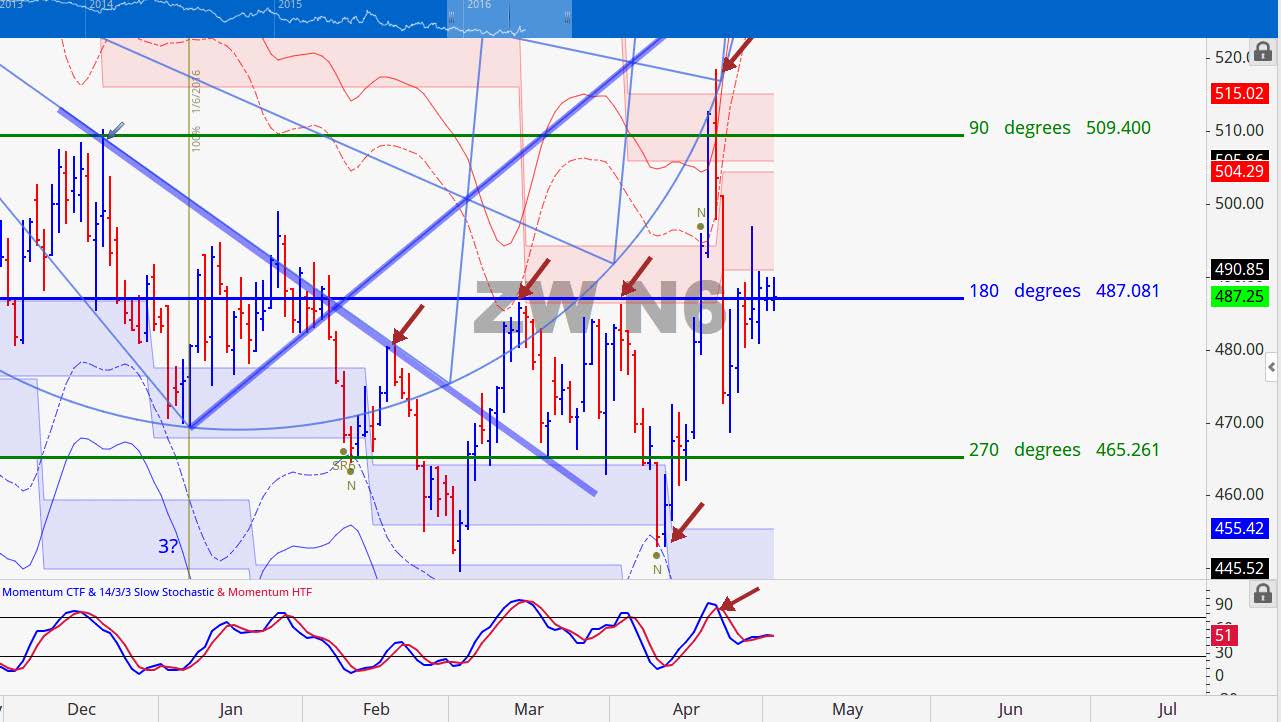
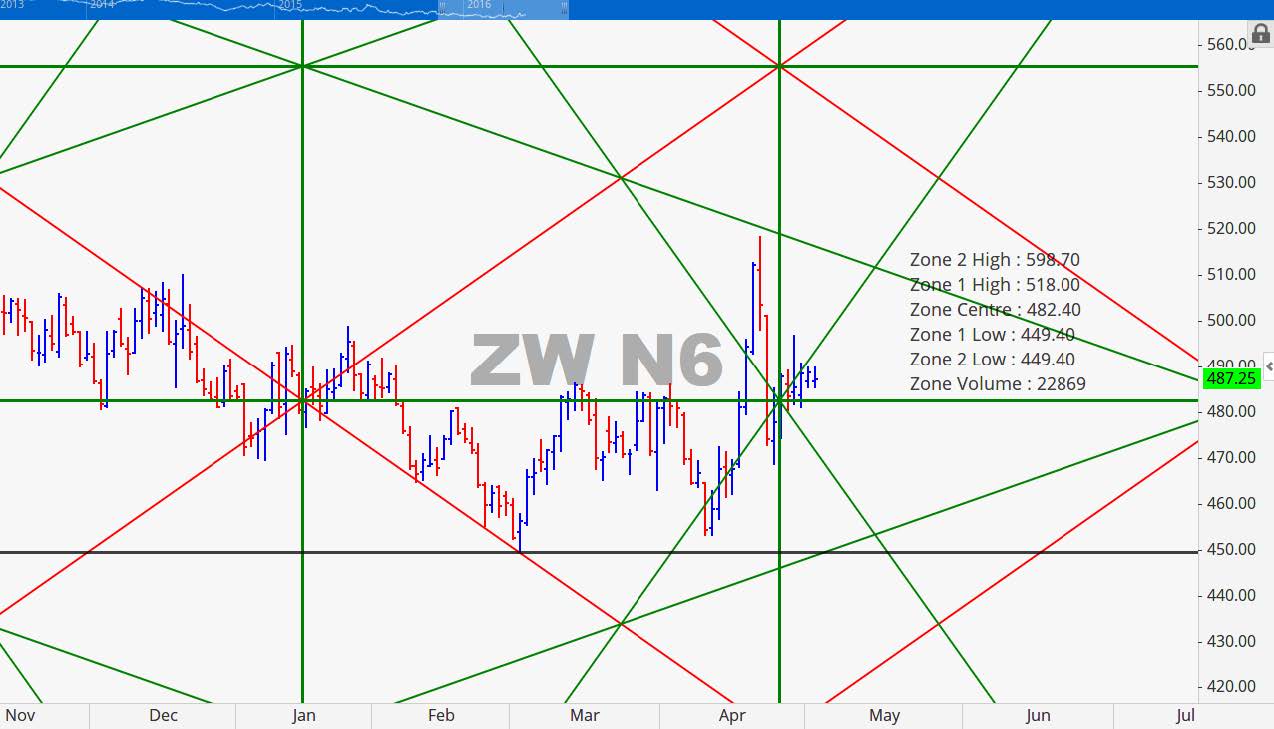
When July Beans advanced from its continuation pattern at the 180 degree mark 968 it wasted little time making it to the 360 degree level of 1031.25. Major overhead resistance now rests at 1063.75. As of the close on Friday of last week prices were close to two price points that are very important for this contract, which are 1028 and 1043.75. A close below 1028 should lead to price testing 999.50 and a close above 1044 could lead to test of 1063.50. The volatility bands are still sloped up so we are inclined to believe that price can still move up slightly or sideways but the aforementioned resistance levels should prove to be formidable.
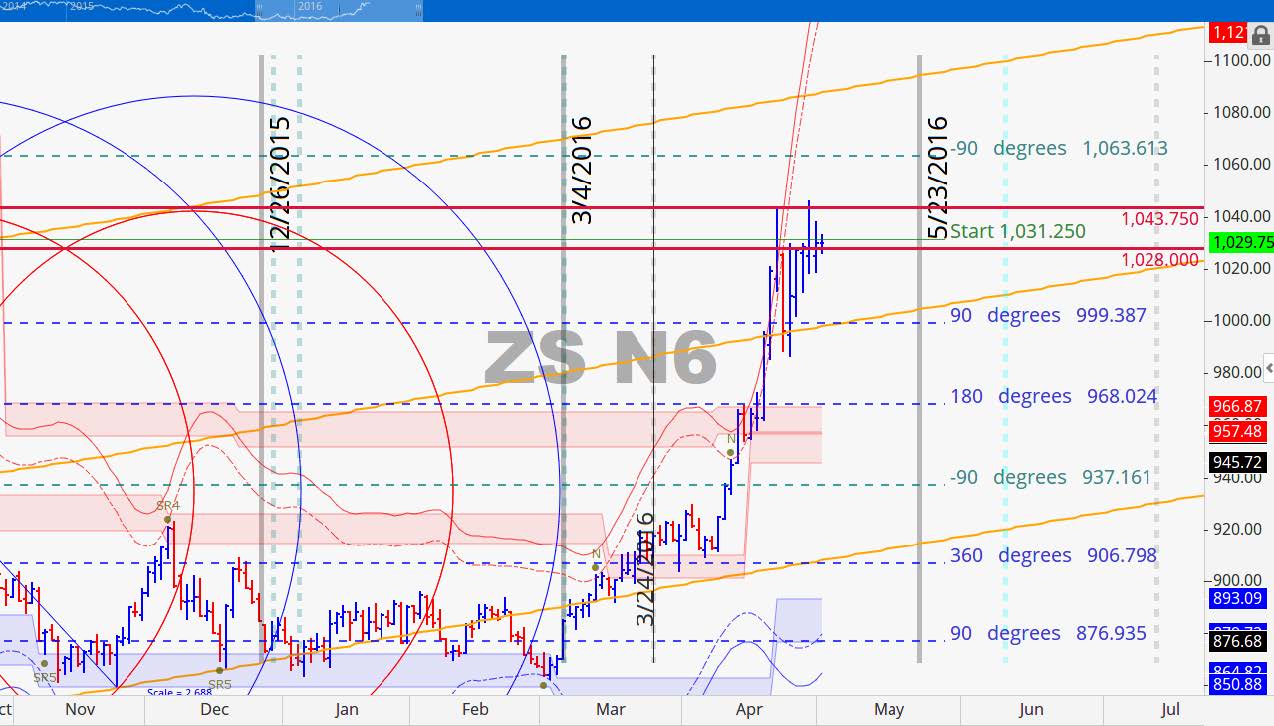
Not only did we roll from the May contract to the July contract but we also realigned the natural angles box to better fit the current price action. In the previous chart we duplicated the box maintain the scale of the market which also works but elected to study a new rhythm for this contract.
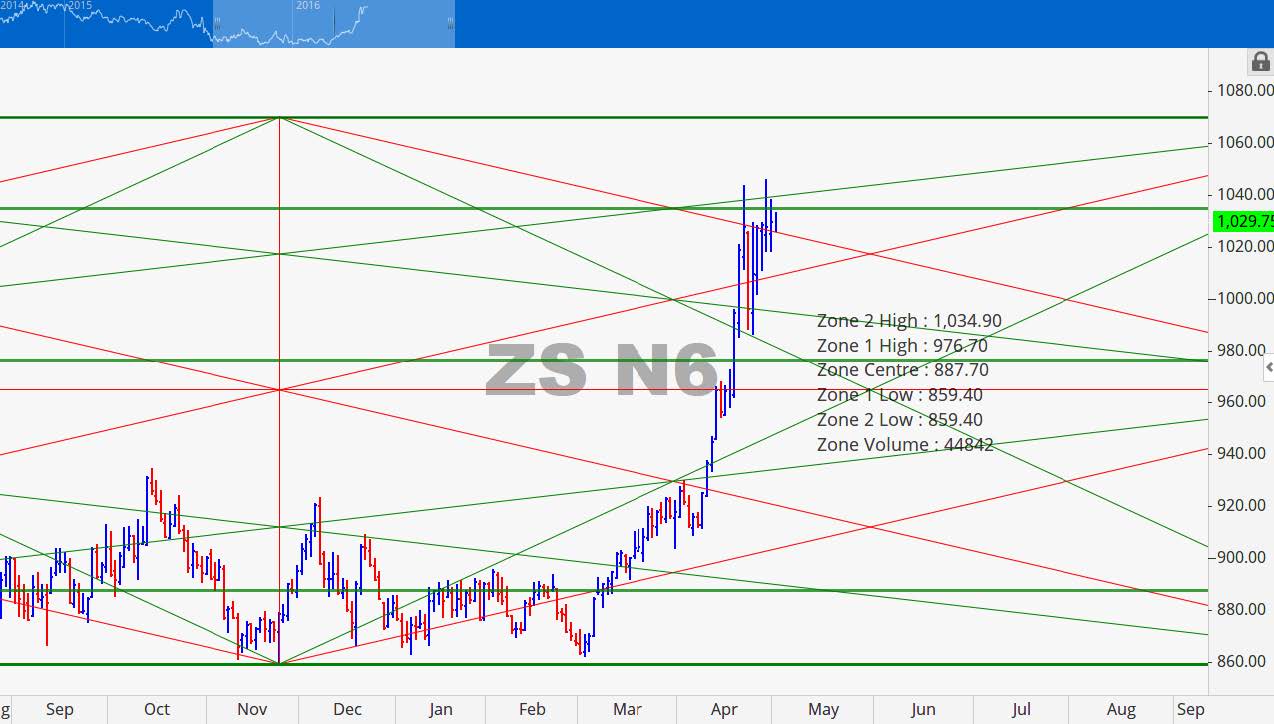
The point of control for this contract is 887.75. The next two standard deviation levels above that control point encompasses where price currently lives. At 1035 the contract met firm resistance both of the times it tested it. If prices were to close below 1028 in conjunction with an inter-level price vacuum (an absence of volume in between price levels). Thank move down to 976.75 would not be unreasonable target for the May 23 projected time line.
November 2016 Soybean Charts
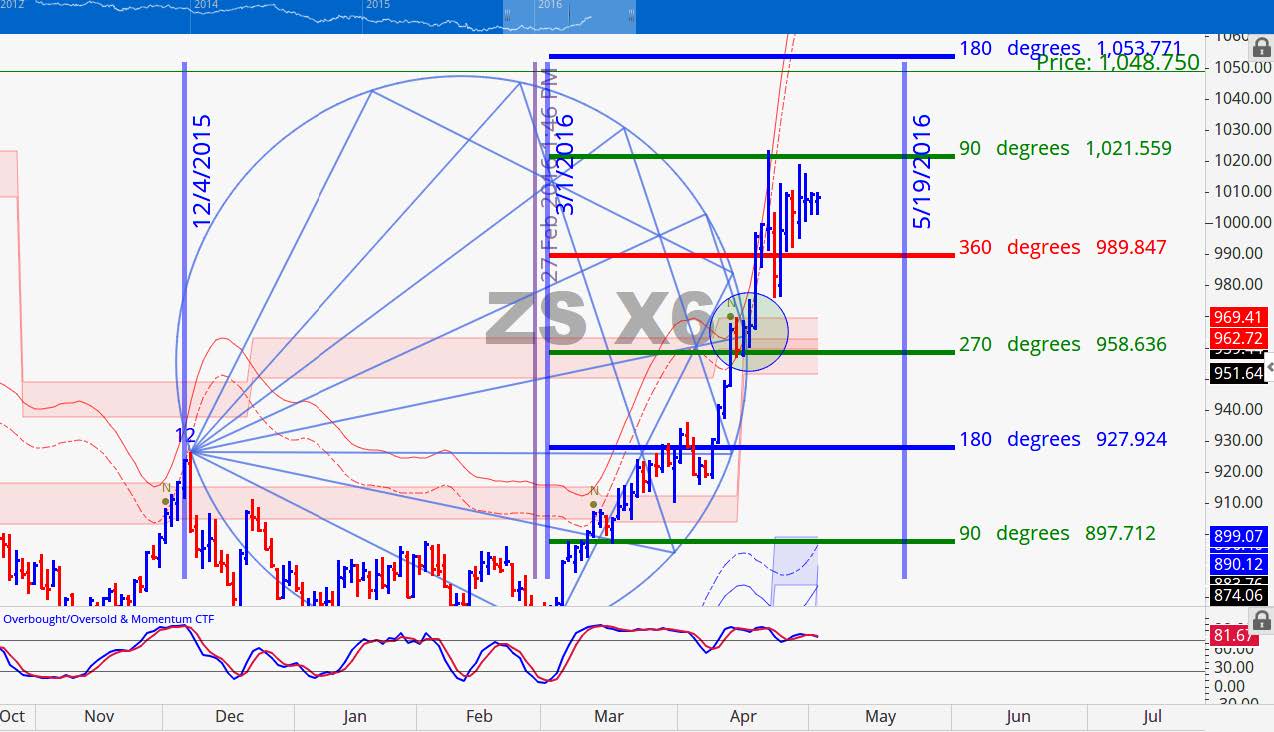
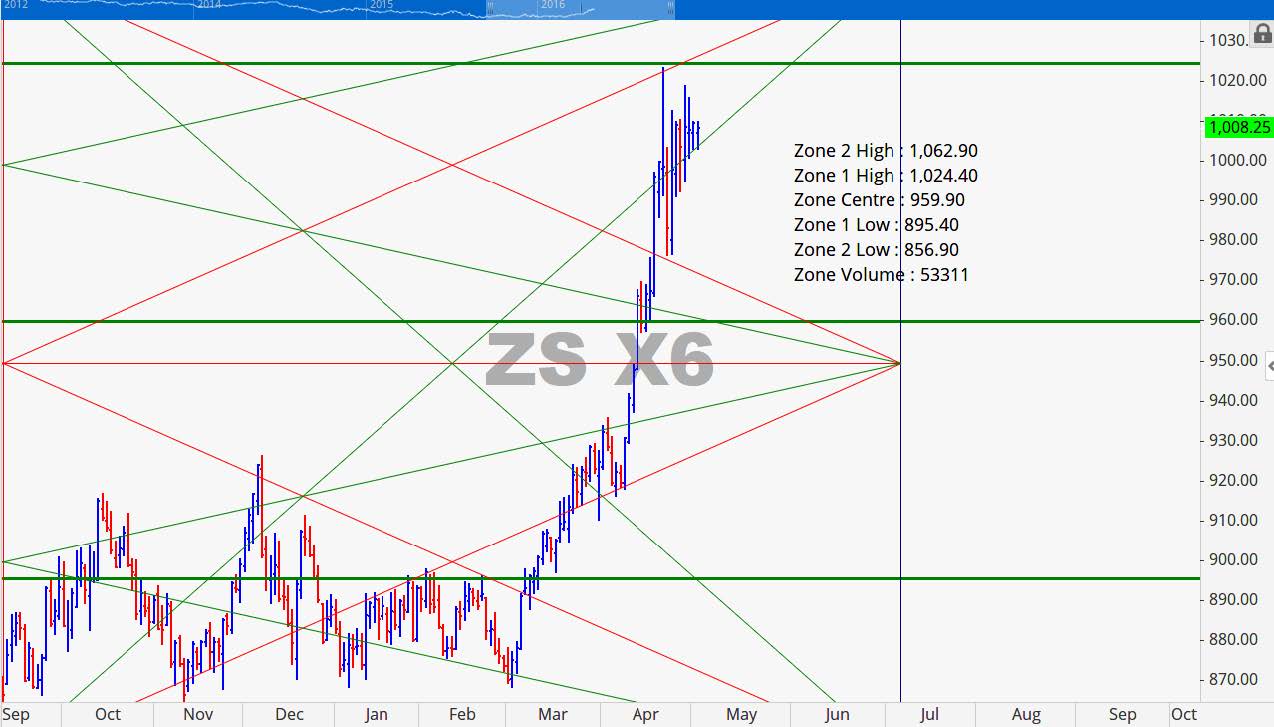
There was not much change for the November Beans contract last week. The price action remained inside of the anticipated 360 and 90 degree support and resistance levels. This week we are looking for prices to test and potentially break downside support at 990. This market has posted two major impulse moves from the low and it at this juncture that late comers that missed the first two impulse moves will buy this market with the aspiration of another impulse move. This is the space where rookies get run over and smart money wise dumps leaving rookies hold the bag.
Grain Market Overview October 11
Read more