
Grain Market Overview 3/2
March 2, 2016Grain Market Overview March 9
March 9, 2016Commodity Market News March 7

Summary
The Brazilian Real surged to a six-month high on Friday, on the news that former president Lula de Silva was detained for questioning in a massive corruption investigation. The strength of the Real made for strength in the agricultural commodities. Coffee and Sugar in particular were the strongest given Brazil is the world's top exporter. Producers were not willing to sell at such low prices. This rally in the Real coincided with a bullish advance on Brazilian equities. One would think that the corruption probe into the ruling party, which has lifted hopes of a regime change would have caused their equity markets to fall.Corn
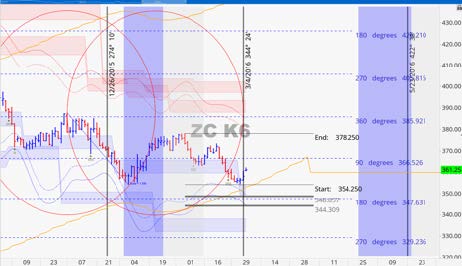
Corn was down for most of the week last week until it made a reversal bottom on Thursday followed by a strong rally on Friday. It was almost able to finish the week in positive territory. May Corn was down 1 ¼ cent and December Corn only lost ¼ cent. The tone early in the week was bearish with the weekly Corn export inspections at 737.6k metric tons which were quite disappointing coming off of the heels of the prior week’s 908.8k metric tons. Last year at this time the export number was 1.281 million metric tons. Instead it was the market technicals that prevailed at the end of the week. We had a potential cycle time line of March 4th (plus/minus a day either side). It came very close to testing the January 7th low on March 3rd and has been moving up since. Our first level of resistance for the May contract is 366 ½ and a close above 374 ½ (one deviation from the point of control) this week could lead to a test of 386. The December contract has resistance at 386 if it is able to clear 390 ½ (the point of control) then it looks to test the 396 to 400 range.
May 2016 Corn Charts
Soybeans
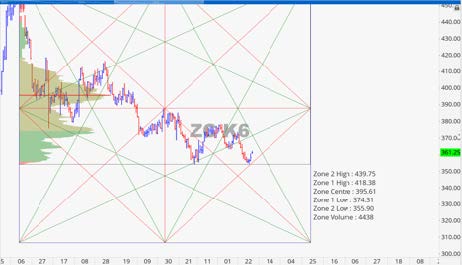
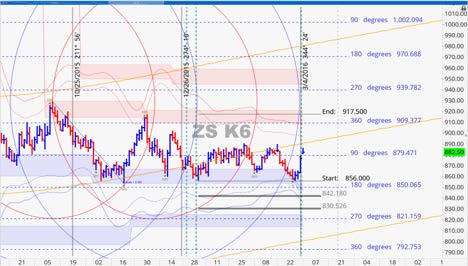
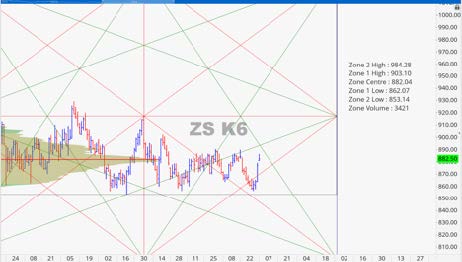
The weekly Soybean export inspections came in at 1.048 million metric tons which was 500k metric tons below last week’s number. Although, cumulative exports are on pace to meet USDA expectations. The Soybean market bottomed a day before Corn then posted a massive rally on Friday. The May contract finished up 15 cents and the November Beans also climbed 15 cents. Both contacts have been inside of a long standing trading range and are poised to move higher this month if they are able to sustain their momentum. Our harmonic cycle for Beans was the same as that of Corn. The both contracts touched volatility based support then advanced surprisingly fast. The point of control for the May contract is 882. A strong close above this mark early in the week would be a potential show of strength with a price target of 910. November Beans has its point of control at 889 and already close to resistance at 905. It could make a run to 915 before pausing.
May 2016 Soybean Charts
Wheat
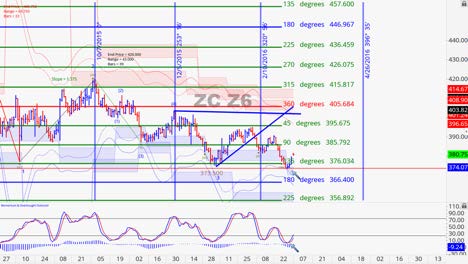
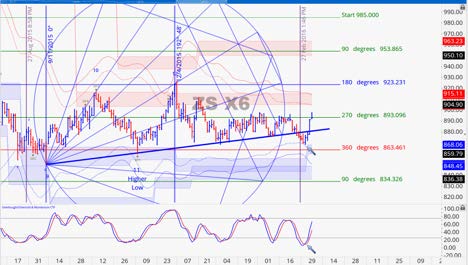
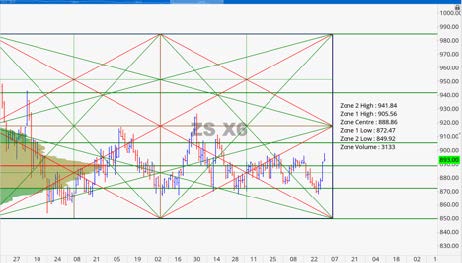
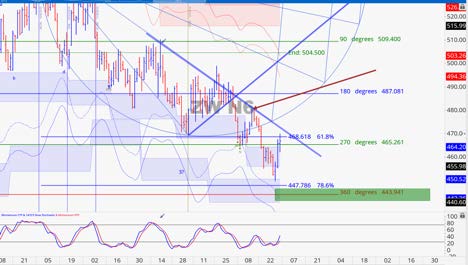
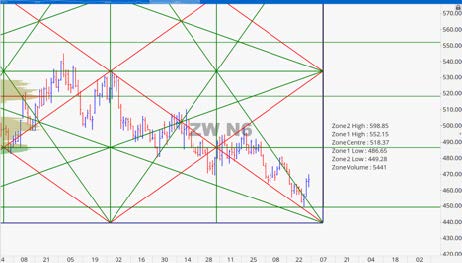
Not much had changed as far as the Wheat narrative was concerned. Last week’s weekly Wheat export inspections came in at 371.9k metric tons which was 102.2k metric tons more than the previous week’s total. Last year’s figure was 480.7k metric tons. Currently, cumulative exports are behind the needed USDA pace. July Wheat futures were very much under pressure through Wednesday when what appears to have been huge short covering fueled by profit taking took command of the price action. CFTC reported specs were at record short levels for both Chicago and KC Wheat. As we have shared in the past when record shorts are reported short term bounces or reversals are not far away. The July Wheat contract hit volatility based support at 450 ½ then turned back up closing just beyond our 270 degree resistance mark of 465 ½. Above 470 we would not be surprised to see an advance to about 485-490 before finding resistance again (486 ¾ is one deviation from the point of control).
July 2016 Wheat Charts
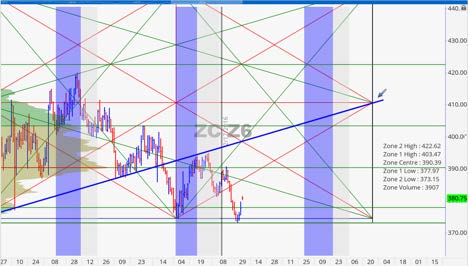
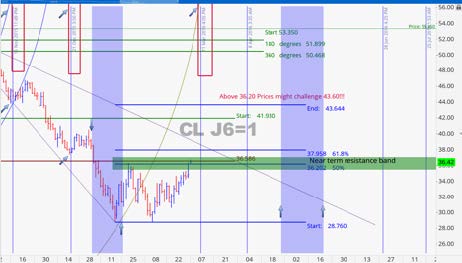
Crude Oil
April Crude finished the week up 3.14. Crude had been on quite the impressive run and it continues to move higher as we projected months ago. The Pundits have it completely wrong when they were calling for $10 Crude. The technicals did not support it going to those levels. In our charts, we pointed out 36.30 as our level of opportunity. We also have a downward sloping trend line above the market. Above these two thresholds we believe that Crude is primed to make a move to 43.60. We have a key date of significance on March 11th for a potential price pivot. It appears that Crude may continue to move up into this date then pull back a bit before potentially heading higher.
Grain Market Overview October 11
Read more