
Grain Market Overview March 16
March 16, 2016Grain Market Overview March 23
March 23, 2016Commodity Market News March 21

Summary
According to a recent Reuters news article, "Brazil's ruling coalition lacks the votes in the Senate to defeat a request to remove left-leaning President Dilma Rousseff from office if it is approved by the lower house, a senior senator in the coalition's largest party said on Sunday.
The leading member of the Brazilian Democratic Movement Party (PMDB), who asked not to be identified because of the sensitive nature of the issue, told Reuters the coalition could not rally the one-third of votes needed in the 81-seat Senate to stop Rousseff being dismissed.
On Sunday, Estadao newspaper quoted sources close to Senate Speaker Renan Calheiros, also a member of the PMDB, as saying he believed that if the lower house approves the ongoing impeachment process it would create an unstoppable wave of support for removing Rousseff."
Hundreds of thousands took to the streets over the weekend to protest their government sending a strong message to the country's "political class".
Last week representatives from the US Department of Agriculture's Foreign Agricultural Service and the US Embassy met with representatives from the Agriculture and Livestock Federation of Mato Grosso (FAMATO), the Mato Grosso Institute of Agricultural Economics (IMEA) and the Soybean and Corn Producers Association of Mato Grosso (APROSOJA). They met with the intent of refining bilateral relations between the US and Brazil in an effort to better understand the agricultural situation/market reality in Brazil and to better understand the agricultural situation in Mato Grosso, which is Brazil's largest grain producing state.
US farmland prices have fallen for a 28th successive month. A US farmland price index compiled by Creighton University came in at 20.2 for March 2016, down from the 9.6 from last month. We are well below neutral (which is the 50.0 level). The decline is a reflection of the weakened agriculture sector profitability as shown in debt restructuring reports for under-pressure farmers according to bankers surveyed by Creighton. Jeffrey Bonnett, a surveyed banker, at Havana National Bank in Illinois, told the survey that the debt restructuring is "a Band-Aid until commodity prices get back in line. Farmers will not be able to sustain in such a low price environment for too many more harvests."
Corn
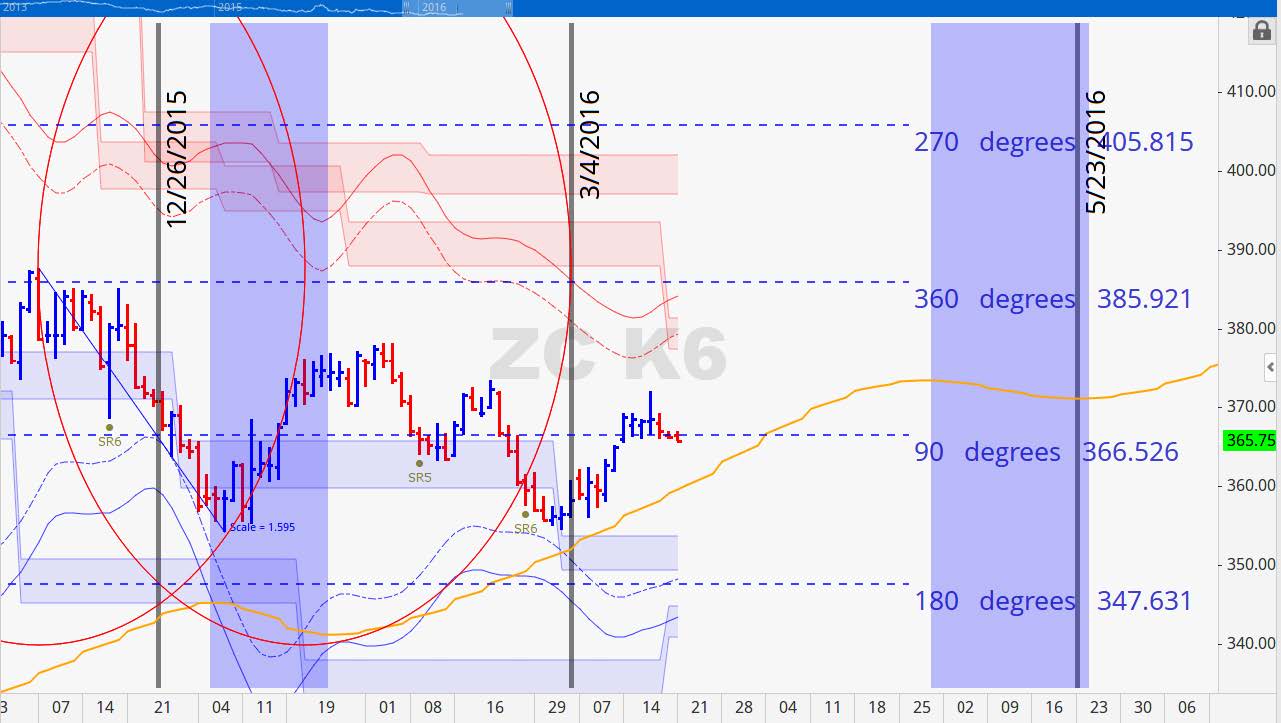
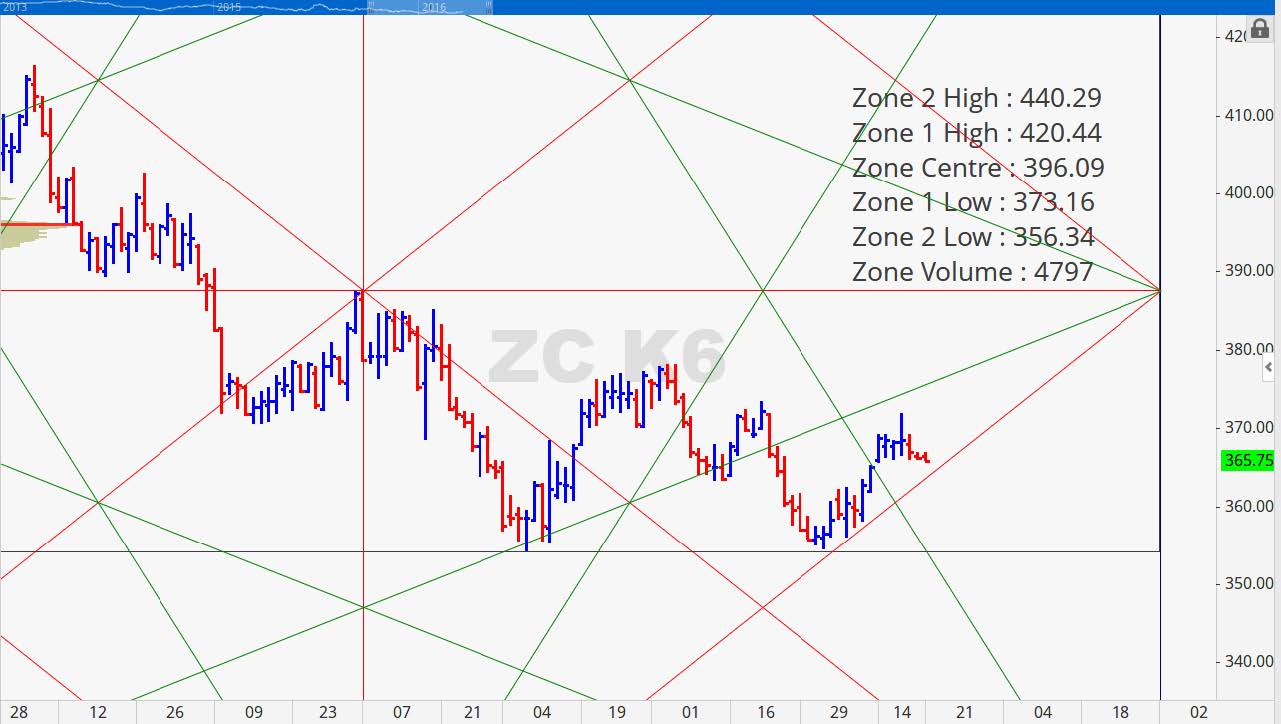
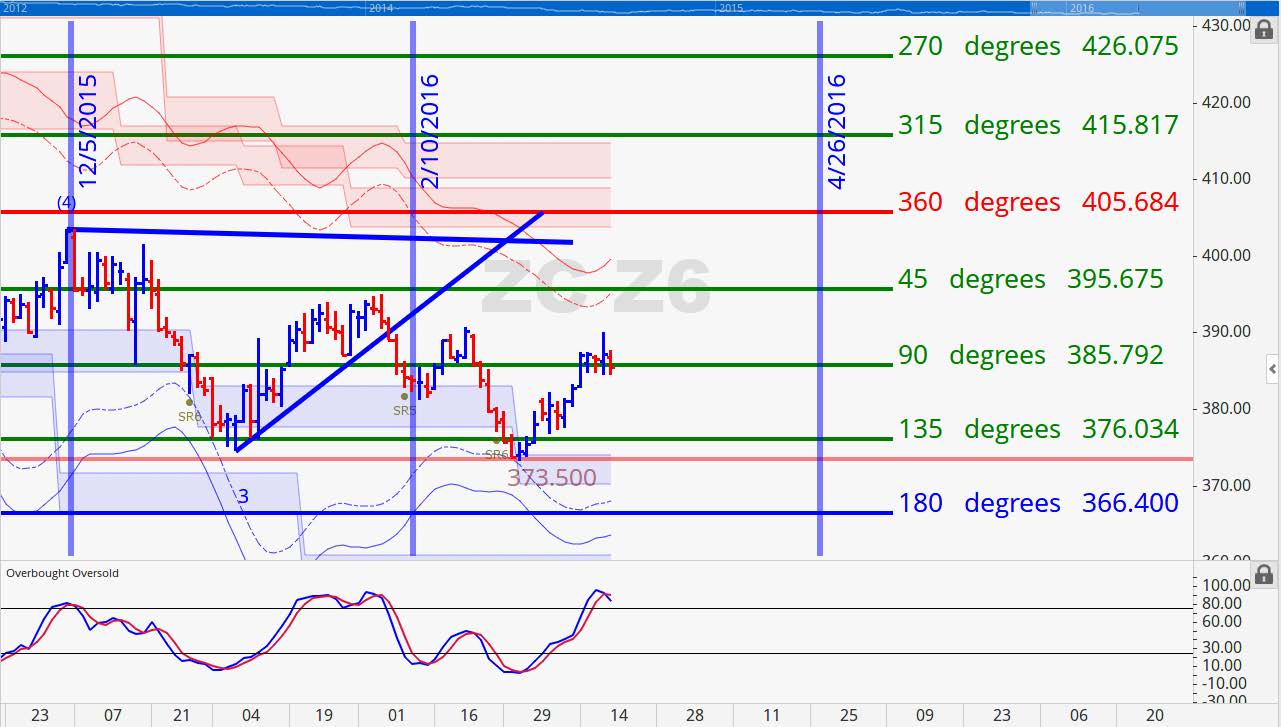
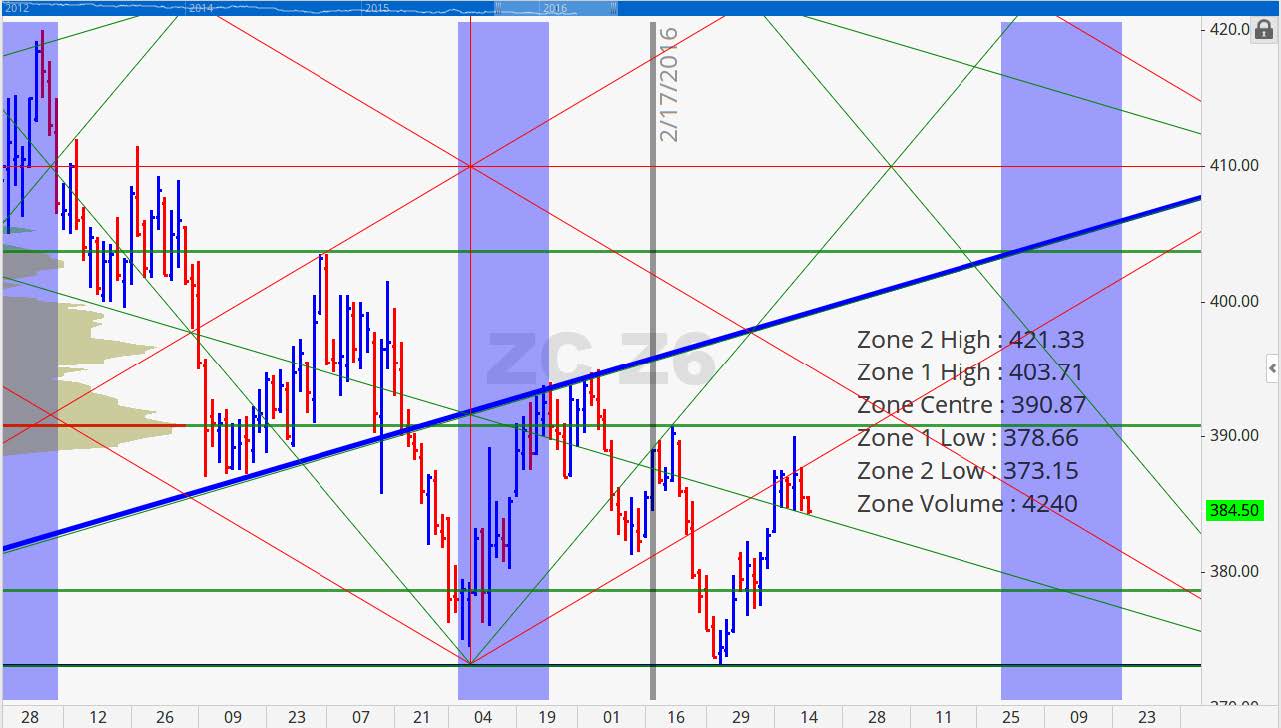
The Argentine corn crop is just underway. They are about 4% harvested with good reports. Corn and Sorghum planting is starting in Texas. Corn is 20% and Sorghum is 15% planted in Texas. They are on pace with the 5 year average. May Corn traded inside of a 6 1/2 cents trading range last while the December contract clipped a 7 cent range. Both finished the week near the bottom of the weekly bar's range. Breaking and remaining below 366 would confirm a lower double top formation which is bearish. The net spec position currently sits at 228k contracts after the COT report reported that 38k contracts were covered last week.
We have a timing cycle that points to a potential turning point near April 7th. Corn could continue to trade sideways until then at which point the cycle corresponds with a decline until early summer. Rallies in May are potentially reasonable opportunities to position oneself short. The potential top looks to align itself with the start of the Corn planting season.
The high of the week was 1 cent shy of our 373 resistance level (one standard deviation below the 396 point of control. If prices are able to break 373 on the May contract we believe that it will have considerable trouble getting past the point of control. The December contract's high last week was a cent below its point of control. The price range of 404-405 should give it trouble.
May 2016 Corn Charts
Soybeans
Brazil's Soybean harvest is now past the half way mark. Crop estimates are approaching the 102 million tonnes level. The Argentine harvest is just getting started. They are reportedly 1-2% completed. The February NOPA Crush report surprised the trade blowing through estimates that ranged from 136 to 144 million bushels. The final figure was 146.181 million. The specs vigilantly reduced their net short positions covering 80% of their net shorts. Over the past two weeks they have gone from 135k contracts to 27k contracts according to the COT report.
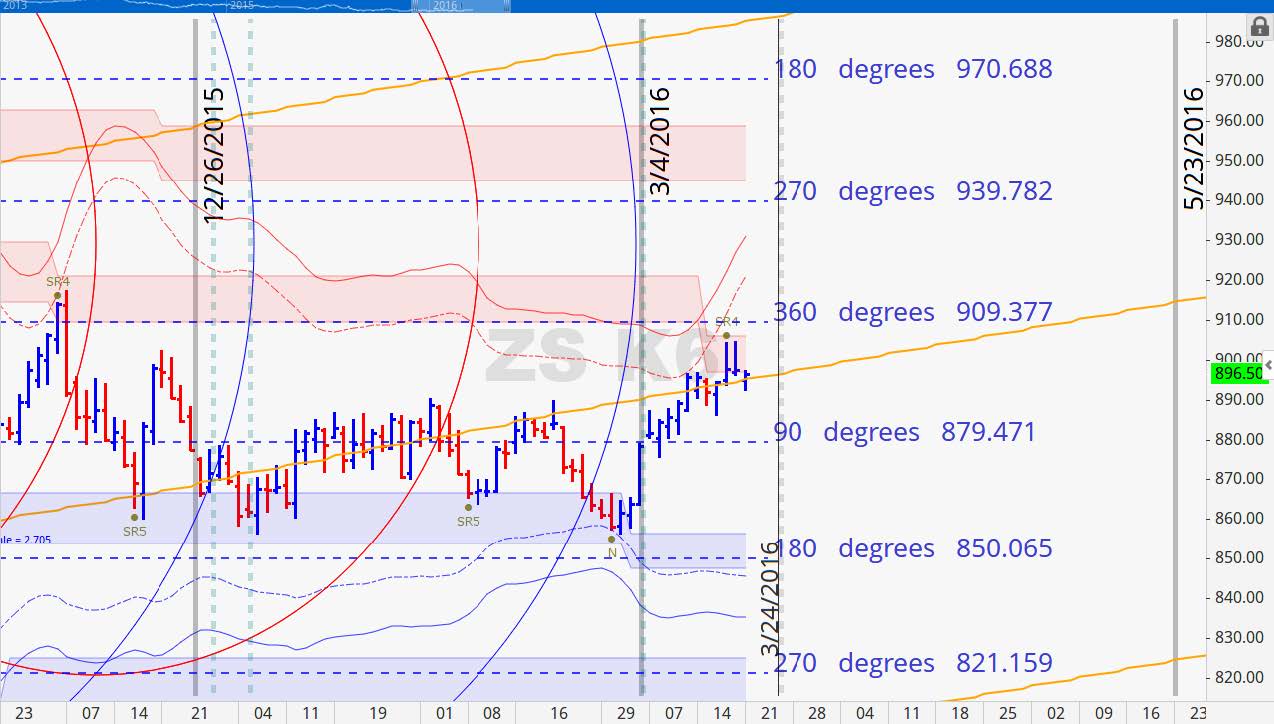
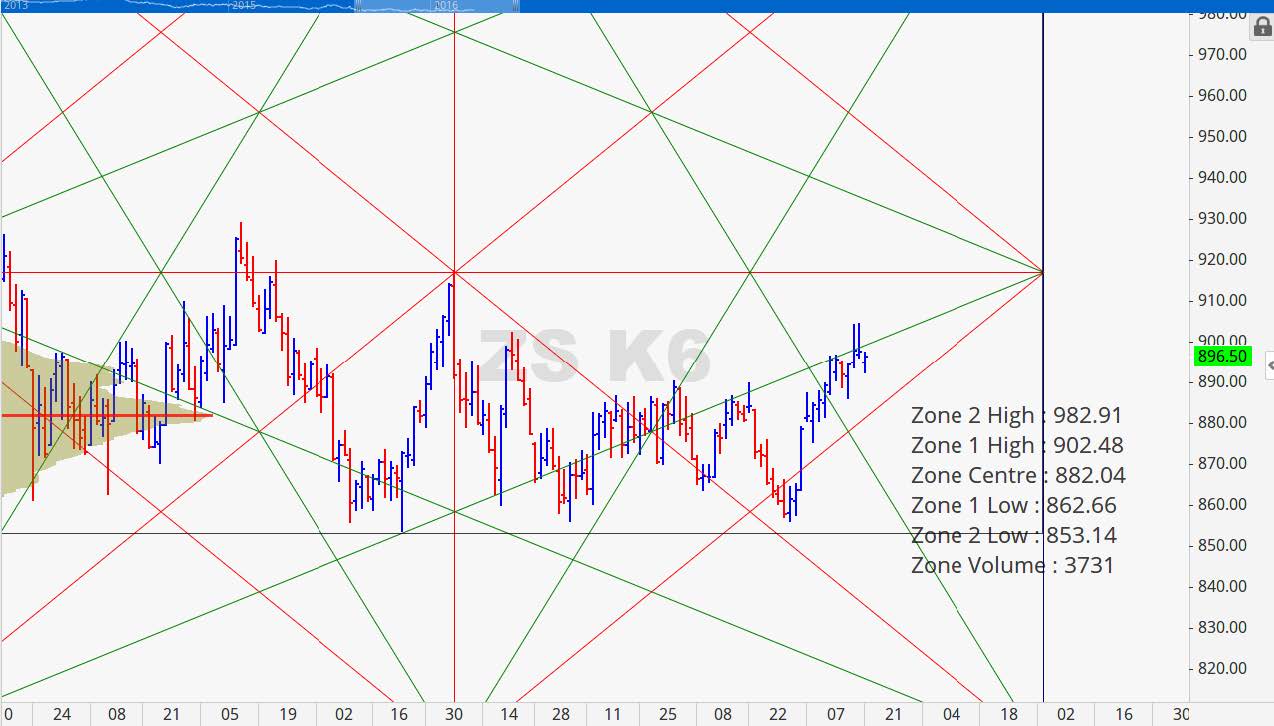
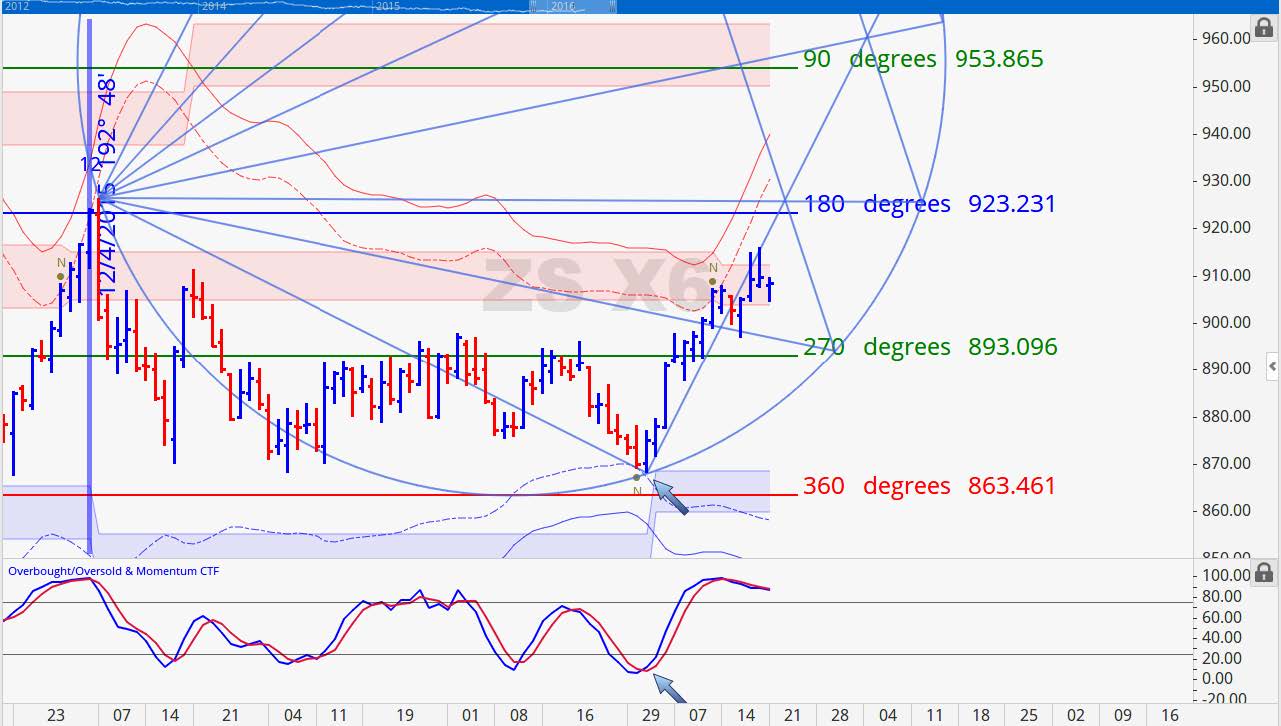
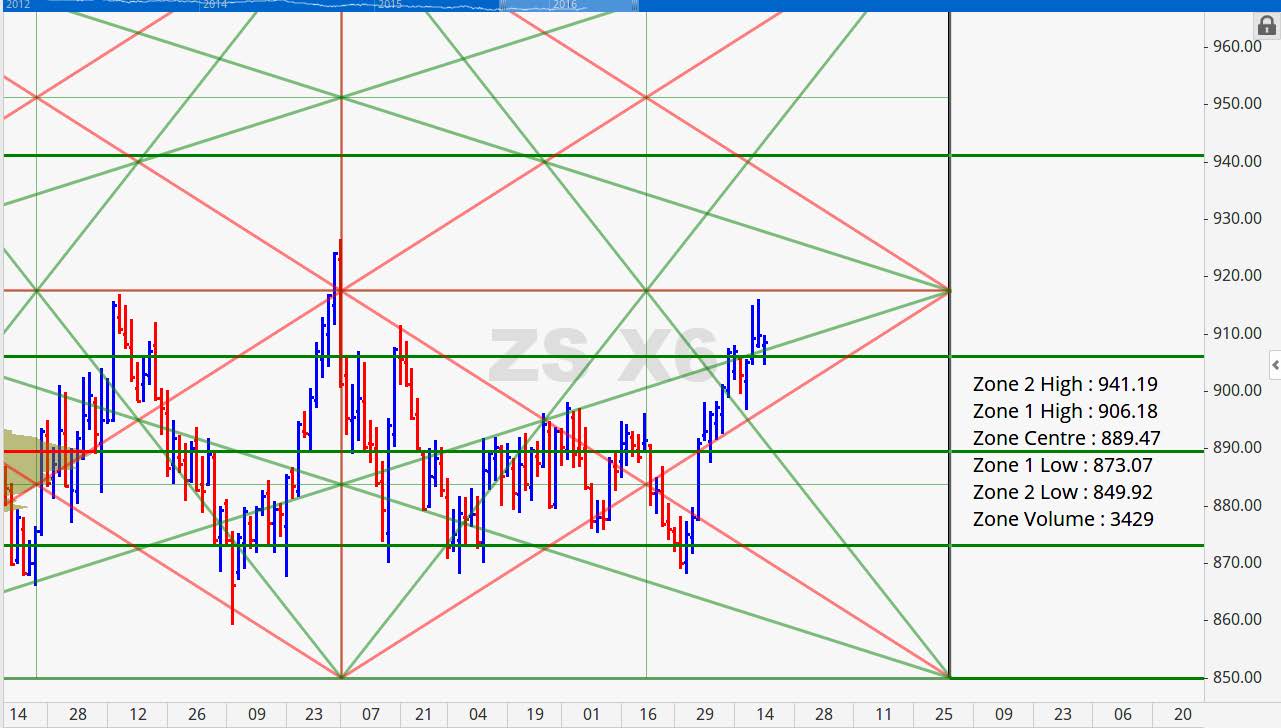
We anticipate that the currently rally in Beans could be last rally of significance before a potential decline into April 2016. The planting for US Soybean should start in the second week of April 2016 and our cycles point to a decline through mid to early May. We would not be surprised to see Beans trading below 800 by the time May 11th rolls around.
As evidenced in the charts, both the May and November contracts made tops near key levels. If Last week's high holds this week look for a steady decline in the bean market through early to mid-May.
May 2016 Soybean Charts
Wheat
Egypt historically likes to buy the dips and tender for Wheat when prices are softer. Such was not the case last week on Tuesday when Egypt tendered with front month Wheat at its highest levels since early February. They finished with a haul of 240,000 tons of Wheat. The distribution was 60,000 tons from Romania and the Ukraine each and 120,000 tons from France. Some Winter Wheat crop condition scores were published. Kansas was unchanged from the prior week. Oklahoma was up 1% good/excellent from the prior week. Finally, Texas was up 4% from the prior week.
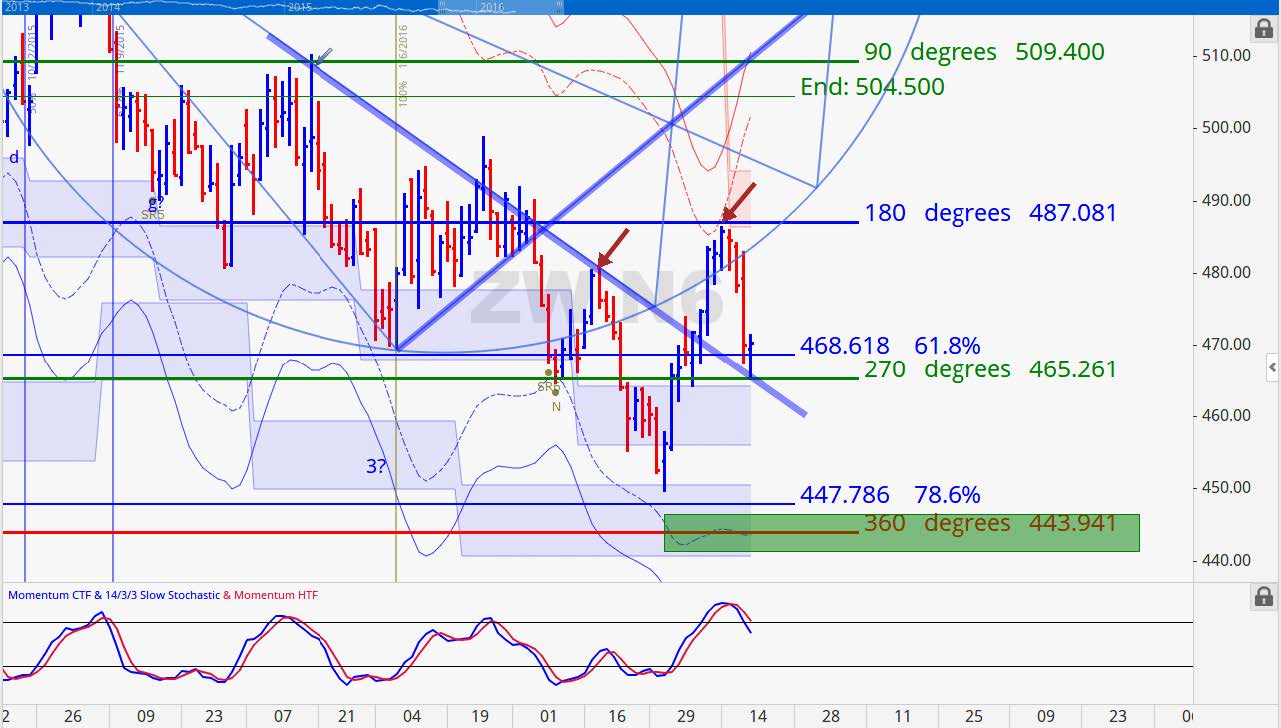
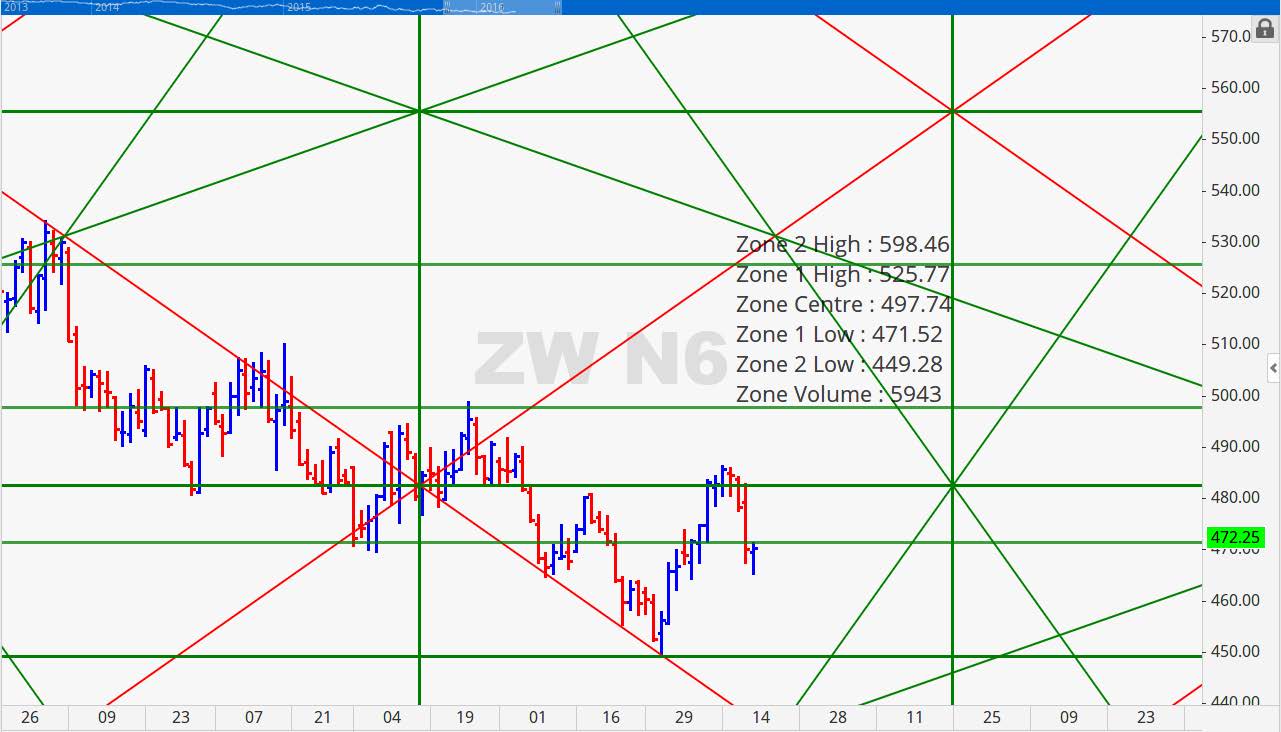
July Wheat was down 12 1/4 cents (2.59%) last week. The Wheat contract was up during the Sunday night session but we believe that upside follow through is doubtful. Last week's high was at 486 1/2. Last week we shared that the next key level for July Wheat was the 487 to 490 range. We signaled that this would be a potential great short opportunity and markets did not disappoint. The high was just shy of the 180 degree mark that coincided with volatility based resistance. Shortly thereafter the market ran down 90 degrees where it found support at 465. We now looking at a potential time cycle low near May 10th where we could see prices at either 430 or even 400.
July 2016 Wheat Charts
Crude Oil
The major oil producing countries are scheduled to meet on April 17th in Qatar. Iran does not plan to attend saying that it has no plans to freeze production until they reach 4 million barrels per day. As of January 2016, oil production in Iran was 2.9 million barrels. The historic decline in oil price has wreaked havoc on production. Take for example North Dakota whose oil production last year in January was 1.12 million barrels per day. This year it is producing 70,000 barrels. Crude inventories at Cushing, Oklahoma continue to grow where stocks are at 67.5 million barrels bringing working storage capacity to whopping 92%.
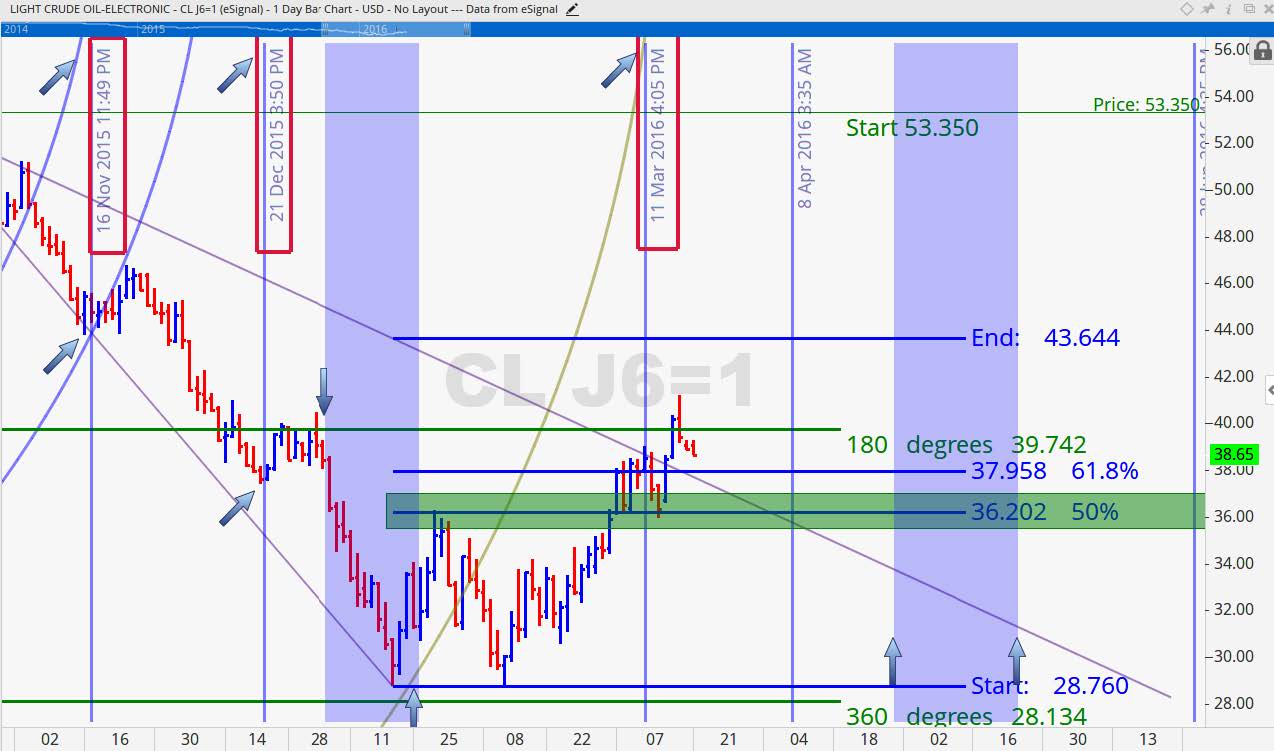
The market is clearly above our key resistance band and expect that Crude has a reasonably clear path to our minimum price objective of 43.60. We still like the April 8th date as a potential turning point. If the market moves up into this timeline then we would look for a strong correction from that point.
Grain Market Overview October 11
Read more