
Grain Market Overview June 22
June 22, 2016Grain Market Overview June 29
June 29, 2016Commodity Market News June 27

Summary
Last weeks the United Kingdom voted to exit the European Union. The impact on the markets (grain, oilseed, equity, crude, currency and precious metal) were pretty much immediate. The vote was responsible for a massive rally in the US dollar – perfect time for those who are traveling out of the country for vacation over the Independence Day holiday. Gold futures were also firmer but the equity markets, crude oil and commodities in general took a beating. Headlines are reporting that $2.7 trillion was wiped away from global markets in the aftermath of the vote. Overwhelming consensus is suggesting that the selloff was overdone. This week the markets will look to digest the implications of Brexit and try to put the pieces back together.
Much of the advance that we have seen in the commodity markets over the past 2-3 months has been largely due to participation on the part of Managed Money. We have long said that the advance was not consistent with the fundamental narrative but the price action and the technical are not to be ignored. There must always be a lens or filter by through which we look at the market to give us an edge as to how to gauge the sentiment of participating parties that have the capacity to drive market direction. Given that Managed Money was the primary catalyst for the advance we believed that at the first sign of weakness the market would be in for a very fast drop since there was not any real indication of demand force to support prices. There has primarily been fear. Last week was met with the perfect storm between beneficial rain and Brexit the commodity markets were not able to justify its price gains leaving Managed Money running on top of each other liquidating hoping to preserve prior gains.
According to the CFTC COT report, Speculative investors reduced their net long positions in Corn for the first time in five weeks. They also reduced contracts in Soybeans last week. The rainfall in the Midwest part of the country was able to improve soil moisture mitigating fears of potential crop damage from previously hot and dry weather. Last week’s rain in all likelihood resolved a number of issues in many parts of the country. The National Weather Service is calling for more rain this week. Thunderstorms are expected in parts of Nebraska, Kansas, Iowa, and Missouri, with the largest amounts falling in southeastern Kansas and northwestern Missouri. Little rain is expected in the eastern Midwest.
Last week’s newsletter showed that the CRB Commodity Index was at key resistance near 2604. A weekly close above that price level would suggest that the price could move up to 2809 at a minimum and would possible have quite a bit of trouble getting past that area when it first makes an approach there. Weakness in the Crude Oil market will also play a key part in the Index’s action given the weight that energy has in the Index. Crude has been very weak the past few days and if the weakness persists it could play a role in weighing down the commodity complex in general. Also note the downward sloping resistance line in the chart. Below this line look for continued weakness and for strength above.

The mid-month time cycle high for Corn and Soybeans worked once again. Corn topped on June 17th and Soybean topped on June 10th. Both markets have fallen down into potential support and the next potential market catalyst ahead is the Quarterly USDA Grain Stocks report scheduled for June 30th. The report happens to coincide with the July 4th time cycle which is worth noting. Producers who heeded our marketing suggestions to hedge near the recent highs are able to breathe a sigh of relief that they were able to lock in some gains ahead of last week’s melt down.
Corn
The July Corn contract fell 53.50 cents (12.22%) last week and the December contract fell 54.50 cents (12.14%). This collapse sent Corn back inside of what had been a long standing trading range prior to its speculative advance. Corn suffered its largest weekly drop in three years. The CFTC COT reported on Friday that Speculative investors were net long 216,371 Corn futures contracts for the week ending June 21st. This was down just over 52,000 contracts from the prior week marking the first decline in five weeks. The narrative continues to support over supply. If the projected record harvest comes to fruition in October/November price would very well remain under pressure and we would look to sell rallies. The upcoming quarterly report should prove to be insightful in giving us an outlook on the supply and demand picture. Small bounces in between the current market cycles are essentially pointing toward a persistent decline into early August barring any weather interruptions. We also have a potential cycle lower high in mid to late August. Once the harvest commences look out below.
Soybeans
July Soybean futures finished the week down 56.50 cents (4.87%) and November Beans were down 69.75 cents (6.07%). But overseas buyers for US Soybean inventories were responsible for an uptick in Soybean futures prices on Sunday night and early Monday trading. The mid-month high that we were calling for in Beans appears to have hit a few days early and perhaps the end of the month low is also a few days early. Overseas buyers for US Soybean inventories are rumored to be responsible for an uptick in Soybean futures prices on Sunday night and early Monday trading. We also show that Beans reached an overbought position on Friday so this advance may have some legs. On Friday, the USDA reported that private exporters announced the sale of 411,500 metric tons of Soybeans to unknown destinations. About 280,500 metric tons is for delivery in the current marketing year while 131,000 is for shipment in the 2016-17 marketing year. Export sales for the week ending June 13 was down from the prior week’s levels but up 13% from the prior four week average. The Soybean planting is right on schedule at 96% compete and should be complete next week.
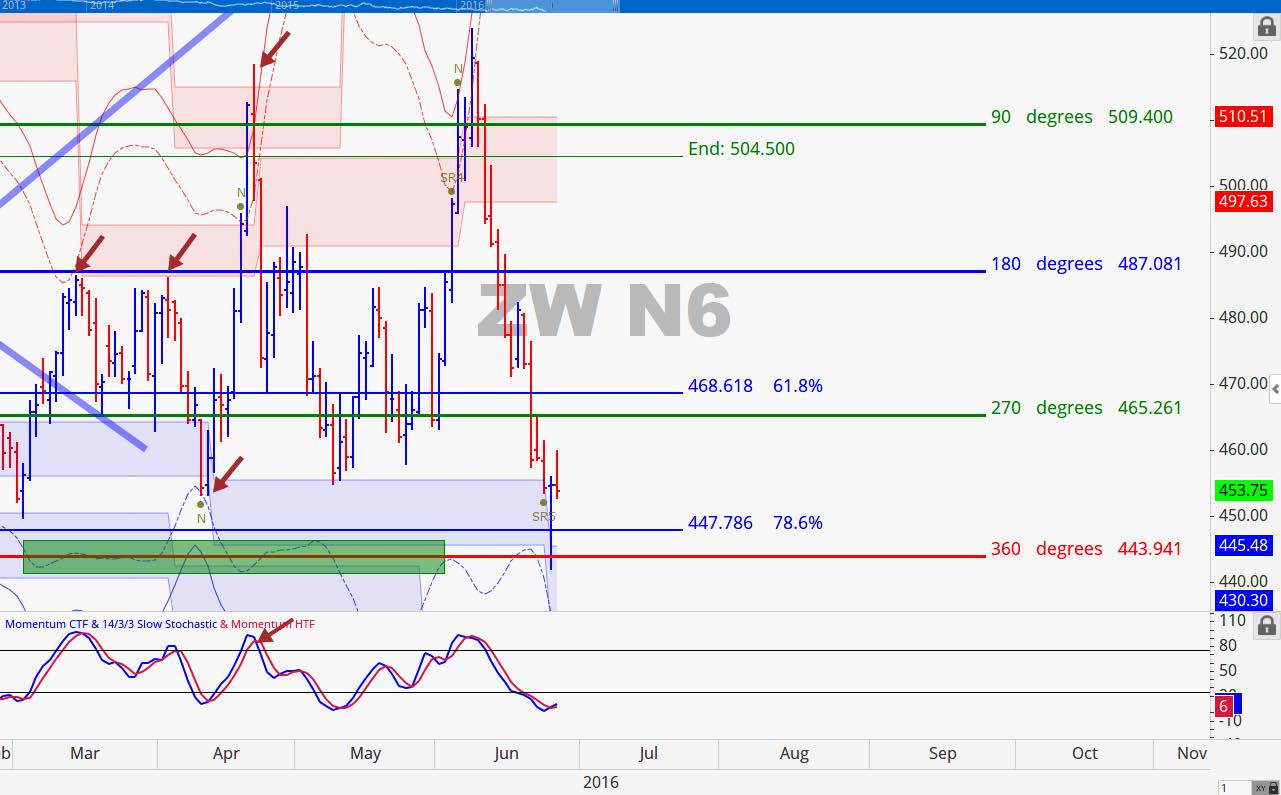
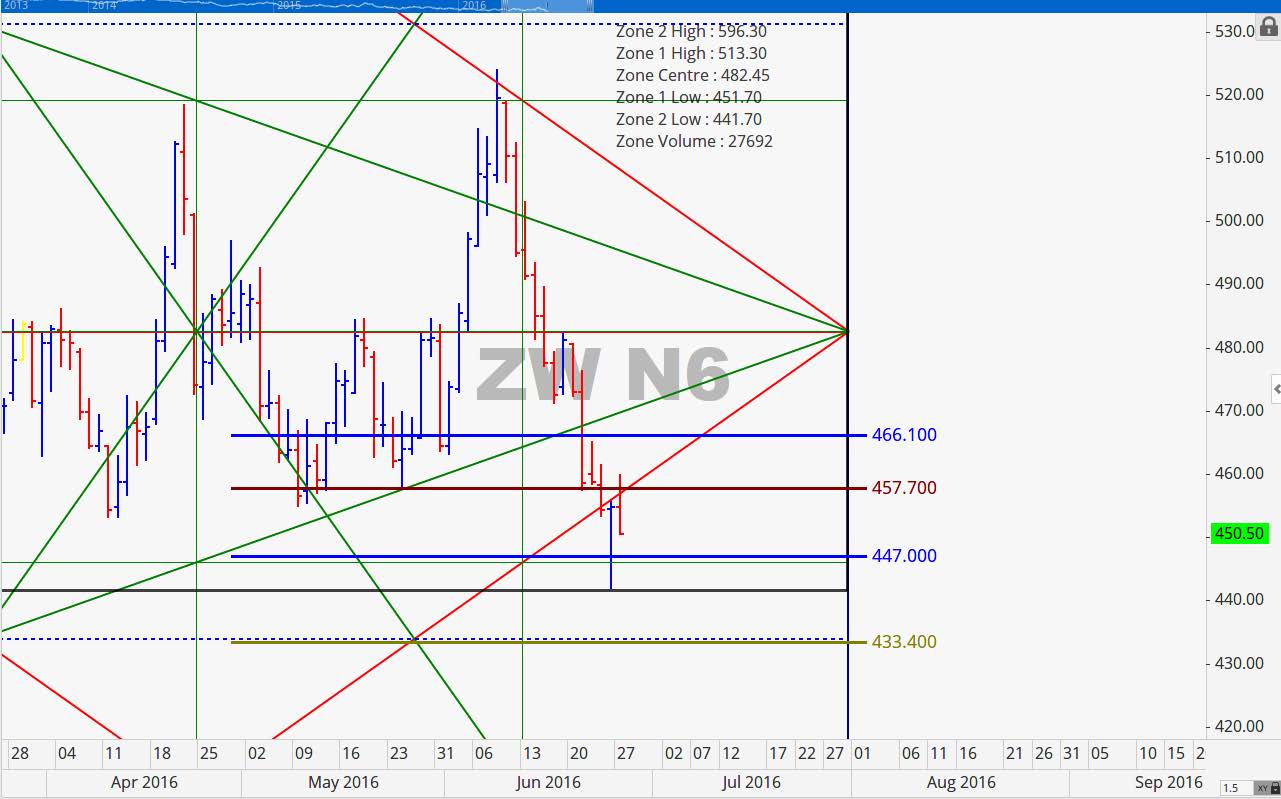
All Wheat
July Wheat closed the week down 26.50 cents (5.51%) and the December contract lost the same amount percentage wise surrendering 28.25 cents of its own. The Brexit vote, strength in the US Dollar and the progressing Winter Wheat harvest were too much for Wheat futures last week. It is not uncommon for grain markets to make lows in the midst of their harvest but something special is going to need to happen to stop this perceived meltdown in Wheat futures.
What appears to be particularly challenging for Wheat is that countries that stand to be the largest importers are also generally the poorest. So the strength in the US Dollar rally makes it very challenging for the US markets to export out to them because they just cannot afford it.
July 2016 Corn Charts
The resistance range of 429 to 433.50 continued to hold as anticipated. This contact broke below 406 and continued to make big moves down through the end of the week. Price broke down almost reaching 369 (90 degree price level). In essence we have moved a half cycle down from the 429 zone down to 388.50. Key spots to look at would be a pullback that reached 410. We do not anticipate that this contract will be able to get above 410 before coming off the board.
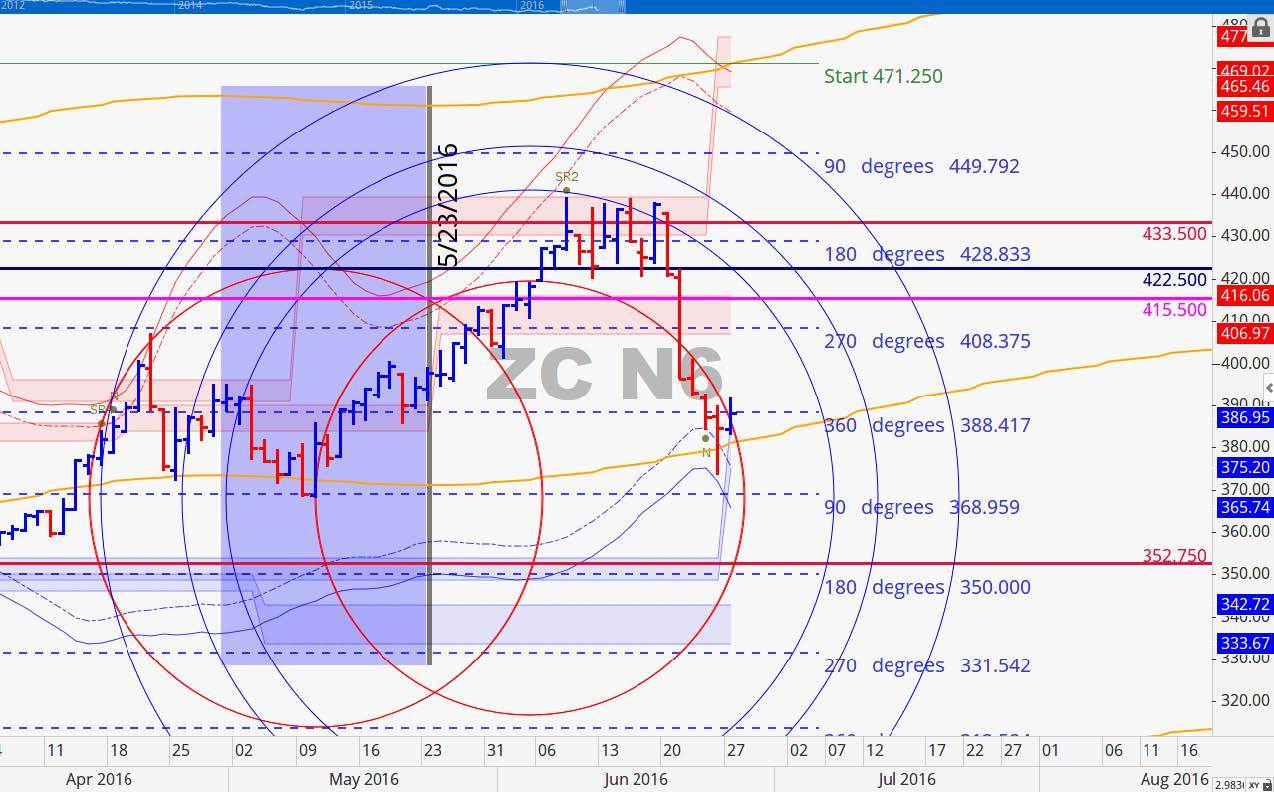
The point of control level of 432.75 was in fact key resistance for the week. The market fell right into our blue vertical time line and Corn might be sitting on a short term low as we head into Thursday’s report. The chart really speaks for itself and we were able to witness another perfect example of what happens to the price action in between the point of control thresholds. Upon breaking through the 432.75 area with strength a vacuum was created and price went straight down to the next level of 390.

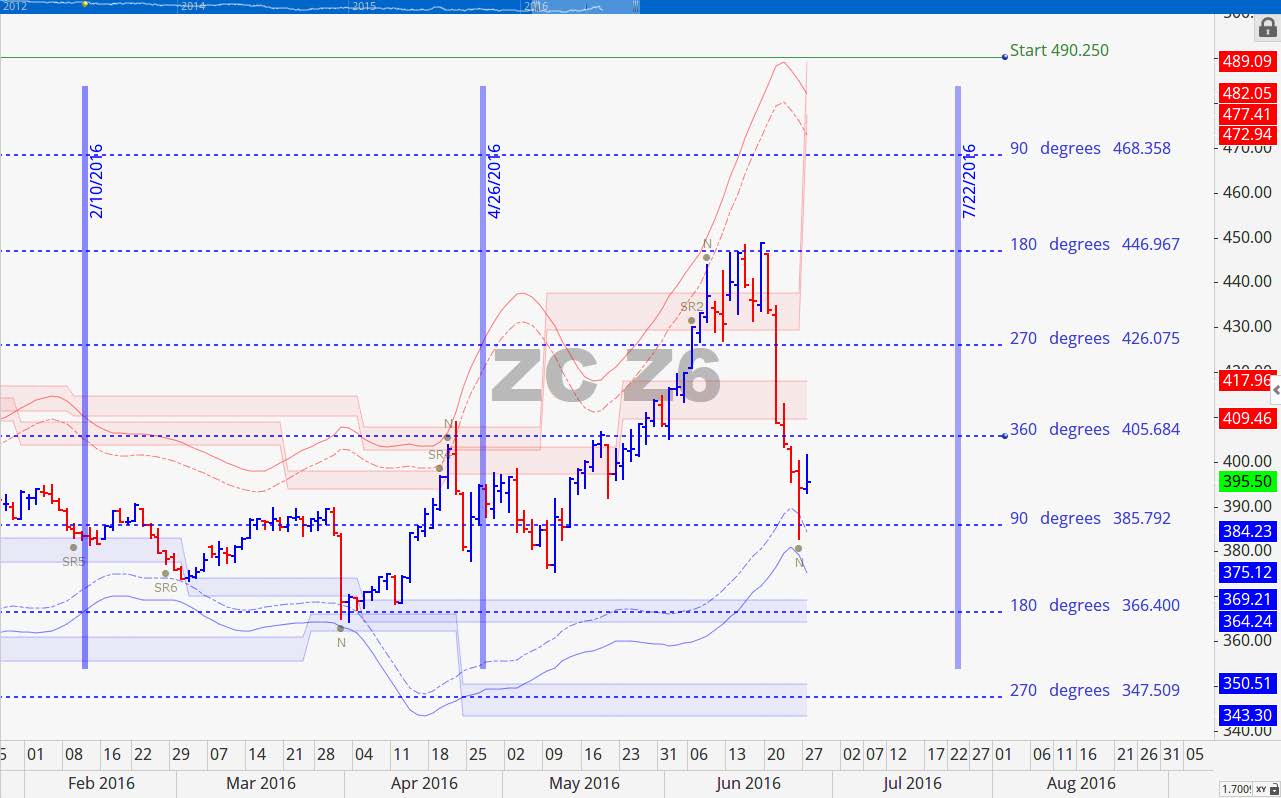
December 2016 Corn Charts
Notice how beautifully the December contract overhead resistance at the 180 degree mark of 447 held off the market. This contract was very close to moving down one full cycle from its high down to 366.50 and it is probable that this contract will reach that price level to complete the cycle move to the downside. Right now 418 is key resistance for this contract as we head in to the report on Thursday. Price could very well move down into the July 4th cycle timeline.

December Corn has its point of control level set squarely at 419.75 which is very close to the aforementioned price level of 418. The 418 number is a volatility based resistance level so in conjunction with the point of control point of 419.75 we could see some fireworks near this area. After the 4th of July cycle timeline the next important point on our radar is July 22nd. Our summer time projection for a move down to 386 at a minimum occurred within the first 3-4 days of summer.
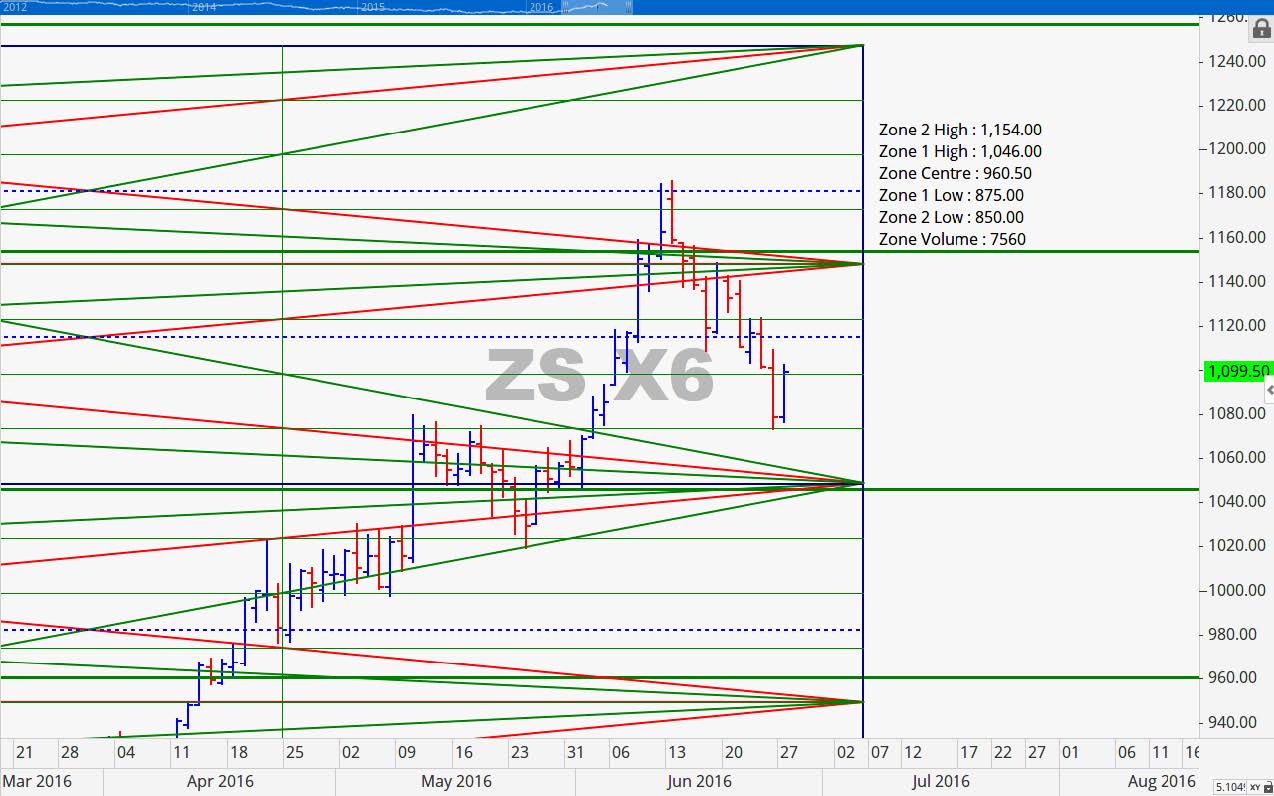
July 2016 Soybean Charts
Last week we shared that the next key support level to watch was at 1110. The low on Friday as 1099.25 and it closed at 1103. Today the July contract is up sharply and is acting directly in concert with our projected chart levels. Notice in the chart below the natural support on the orange upward sloping lines. Compare how it has been key support and resistance in the past. If price is able to close above 1144 in the next day or two we could be in for a rally that tests 1212.25.
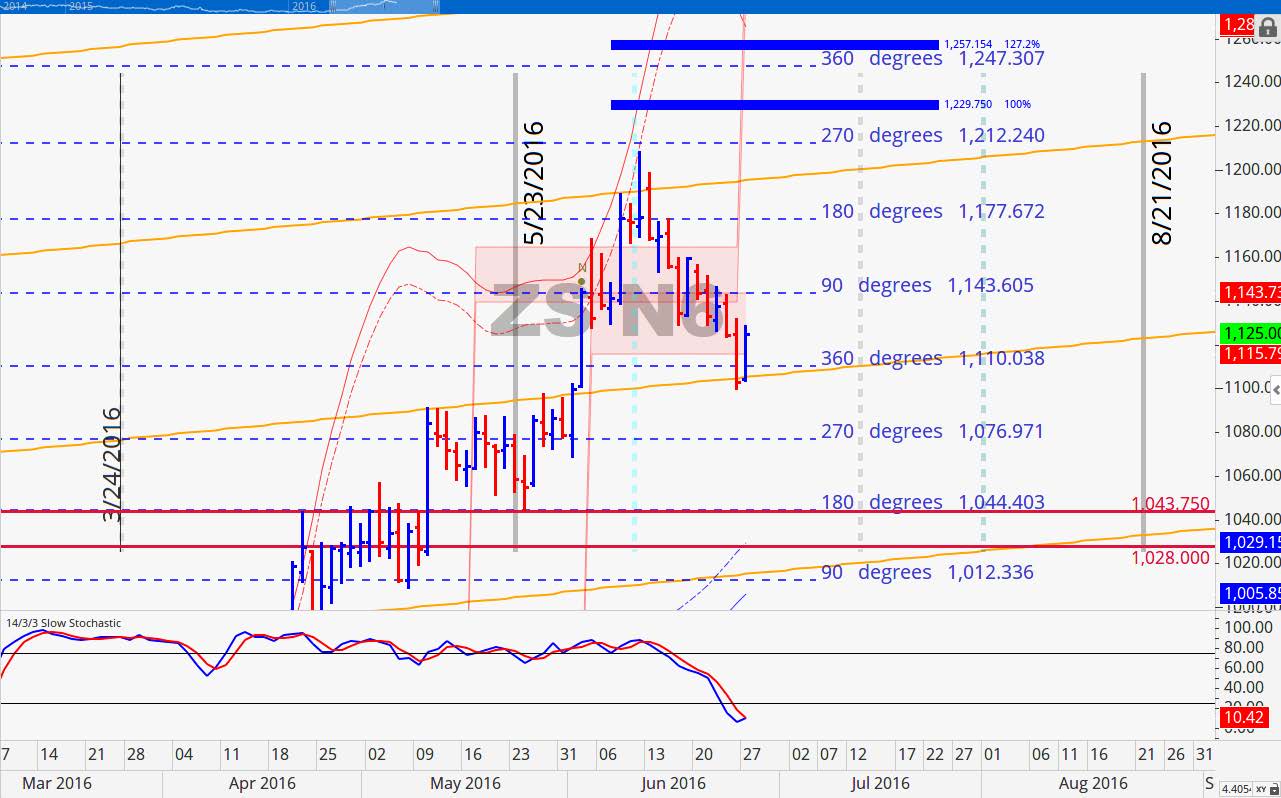
Two levels above the point of control is 1147 which is close to where prices look to close today. Last week we were not able to confirm that our projected top was in but within a few days the confirmation arrived and that top was right on time. This week we expected added pressure with traders rolling out of this contract to the next.
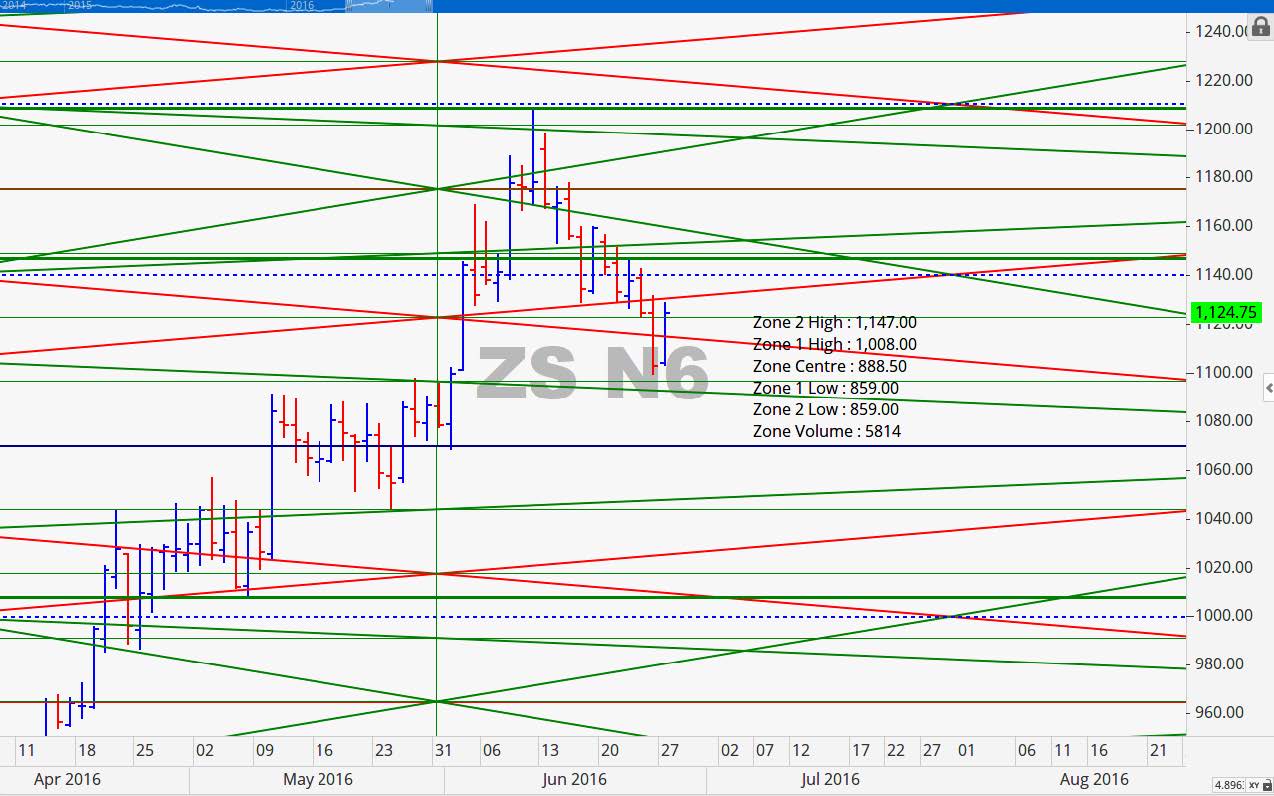
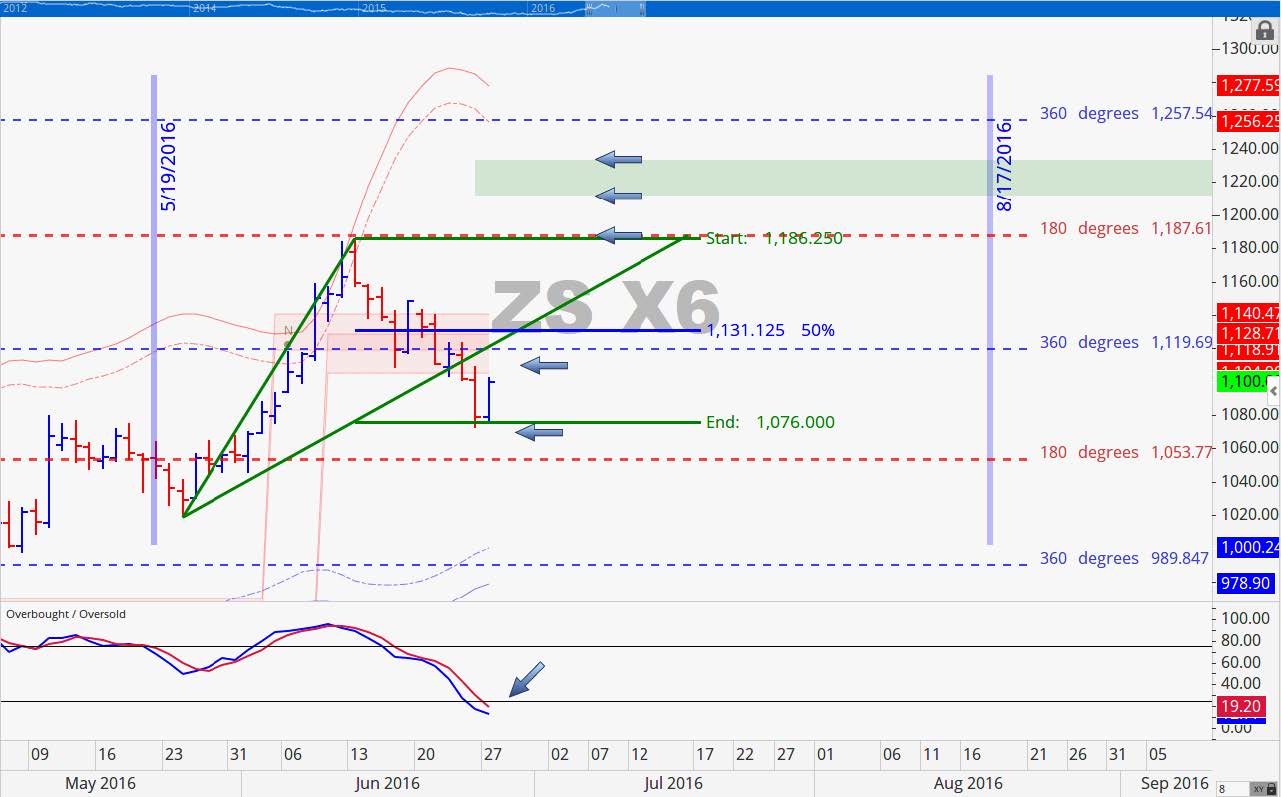
November 2016 Soybean Charts
This contract broke the pivotal 1119 level last week bringing on the projected additional weakness. Additionally, we suggested that 1076 would be support for the week and low of the week was 1072.50 with a closing price of 1078.50. Today we find ourselves in the midst of a strong advance from that level. The technical chart is pointing to a potential move up to 1188 at a minimum with a stop at 1070. There is the possibility that price could reach 1212. In the bottom study pane you will notice that the stochastic has moved into an oversold position.
Grain Market Overview October 11
Read more