

Trade Opportunity – Natural Gas Futures
June 16, 2016Grain Market Overview June 22
June 22, 2016Commodity Market News June 20

Summary
If you are a veteran of the industry you are probably all too familiar with how volatile the Corn and Soybean markets can be during this time of the year. Producers and end users alike are often paralyzed by large ranging intraday moves waiting for unrealistic levels for pricing only to find that prices have settled well outside of levels that would have otherwise been profitable for them. Another factor that is not often taken into consideration is the nature of market timing. Time cycles play a major role in helping access when markets tend to make possible price extremes. A time cycle that is quickly approaching occurs near the 4th of July Independence holiday. Not only is this window a seasonal time cycle, we have also found that around major holidays that trading volume can often be thin leading into and shortly after the holiday. It is during time periods like this that Managed Money can leverage the light volume to move the market more easily. We had previously suggested that Corn could make a top mid to late June and that Soybeans were prone to doing so mid-month. Producers looking to hedge would have done well by selling into rallies near projected timelines. If we get another rally riding into the end of the month that is potentially another opportunity to cover. Weather looks to continue to be a factor in the months to come.
In the interest of keeping tabs on fund buying because of their correlation to the commodity indices we included the weekly chart of the CRB Index. Last week the CRB Index was fairly volatile but ended the week close to neutral against its starting price for the week. Should this CRB Index reach and close above 2604 we consider this a level of opportunity suggesting that higher prices might be ahead. The market now awaits the quarterly USDA Grain Stocks report scheduled for June 30th. The June report has a record of setting the tone for market action.

Corn
The Corn crop condition was unchanged from last week with 96% of the crop remaining in the category of Excellent, Good & Fair. Corn exports were at 31.4 MB which was only slightly behind the pace from last year of 34MB. The CFTC Commitment of Traders report showed that Managed Money’s holding of net short positions was under 5%. July Corn gained 16 cents on the week up 3.78% and December Corn was up 18 cents (4.18%). We believe that Corn can trade sideways going into the end of the month and possibly through the Independence holiday. Volatility is the name of the game as we approach this important time cycle.
Soybeans
Soybean plantings are sitting at 92% complete and continues to be ahead of schedule. Like Corn the Soybean crop condition was listed at 96% as Excellent, Good and Fair. The crop size forecast was unchanged at 3.8 Billion Bushels. Exports came in at 43.2 MB versus 47.2 MB last year. According to the Commitment of Traders report, Managed Money is not bearish in the least. They currently hold less than 2% of total short positions while at the same time is holding 22.2% of long positions. We are looking for Beans to continue lower as we head into the June Quarterly report. Managed Money could very well wait for the report before repositioning. July Beans dropped 18.75 (1.59%) last week and November Beans was off 15.50 cents (1.33%). The Soybean cycle at hand suggests a volatile July followed by lower prices in August and September. The NOPA crush for May was the highest on record for the month at 152.8 million bushels exceeding expectations by 3.2 million bushels. The crush number was 2nd only to the 148.4 million bushels reported last year in May.
All Wheat
Argentina is forecasting that Wheat acreage will increase by over 20% this year due to recent changes in export tax policies. US Wheat exports were strong last week coming in at the largest since July of 2015. Asia and Latin American were the big buyers. The sales figure of 28 million more than tripled the previous week’s numbers. Globally, Wheat harvest will be in full swing in July for the European Union and the Black Sea regions. Those have seen great growing weather for winter crops during the spring and yields are expected to be above average in Russia and Ukraine although the European Wheat quality has been in question. Russia and the Ukraine are expected to have large and good-quality crops. Export competition looks to push prices lower when those crops hit the market in the fall. July Wheat was down 14.25 cents last week, a drop of 2.88%.
July 2016 Corn Charts
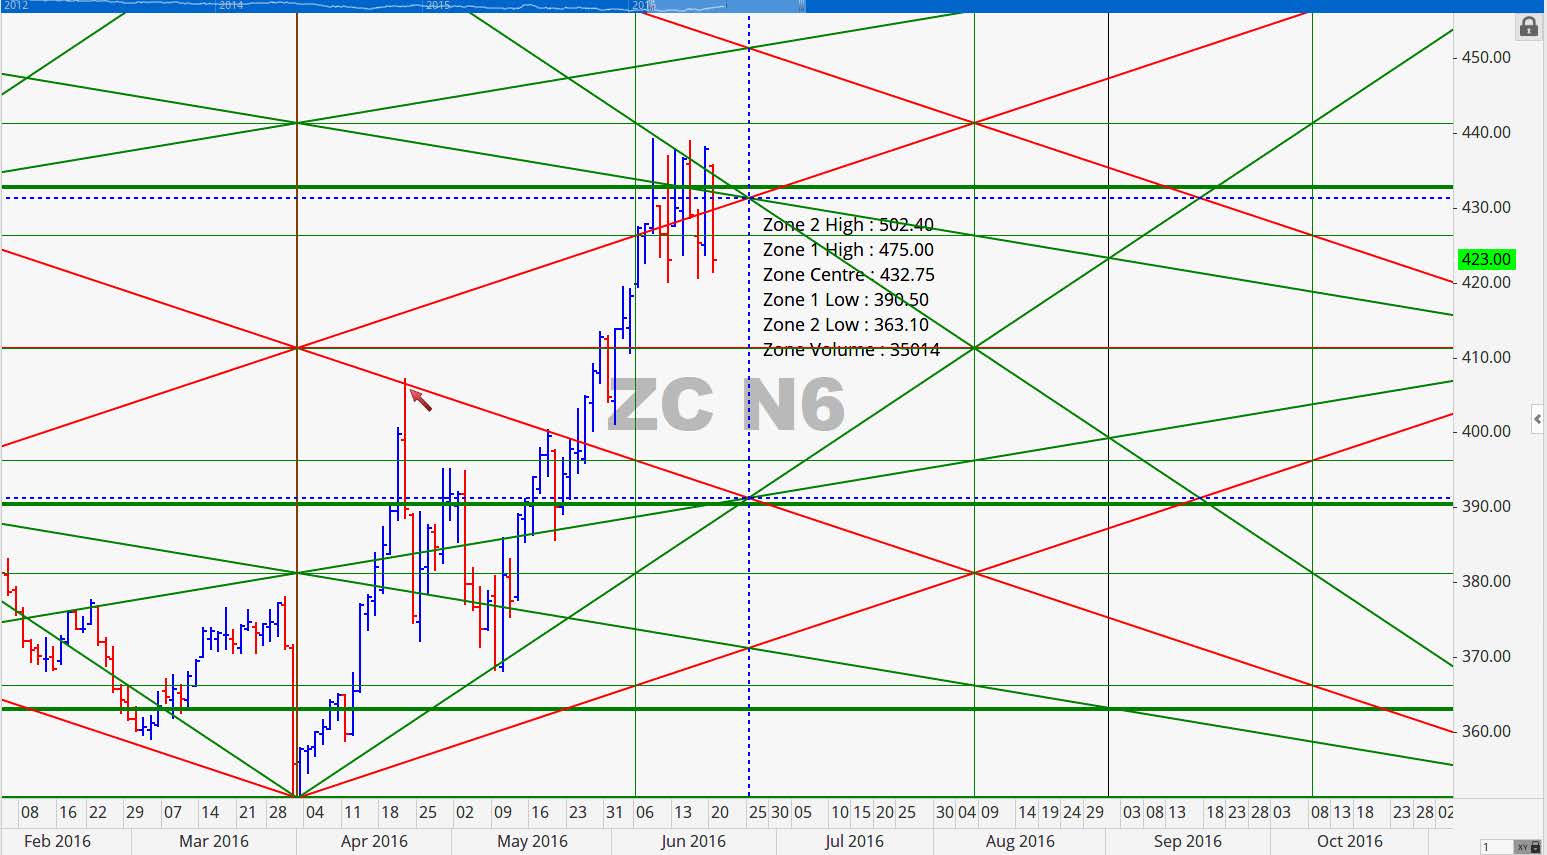
The resistance range of 429 to 433.50 that we shared with you last week was right on point and looks to continue to be a trouble area for July Corn futures through the end of the month. The top end of volatility based resistance is 439.50 and the next key volatility based support range is 407 to 416. Below 406 we could see a big move to the downside shortly. Volume has been light this past week comparatively for both this contract and the December contract. As mentioned previously we are projecting sideways movement through the end of the month.
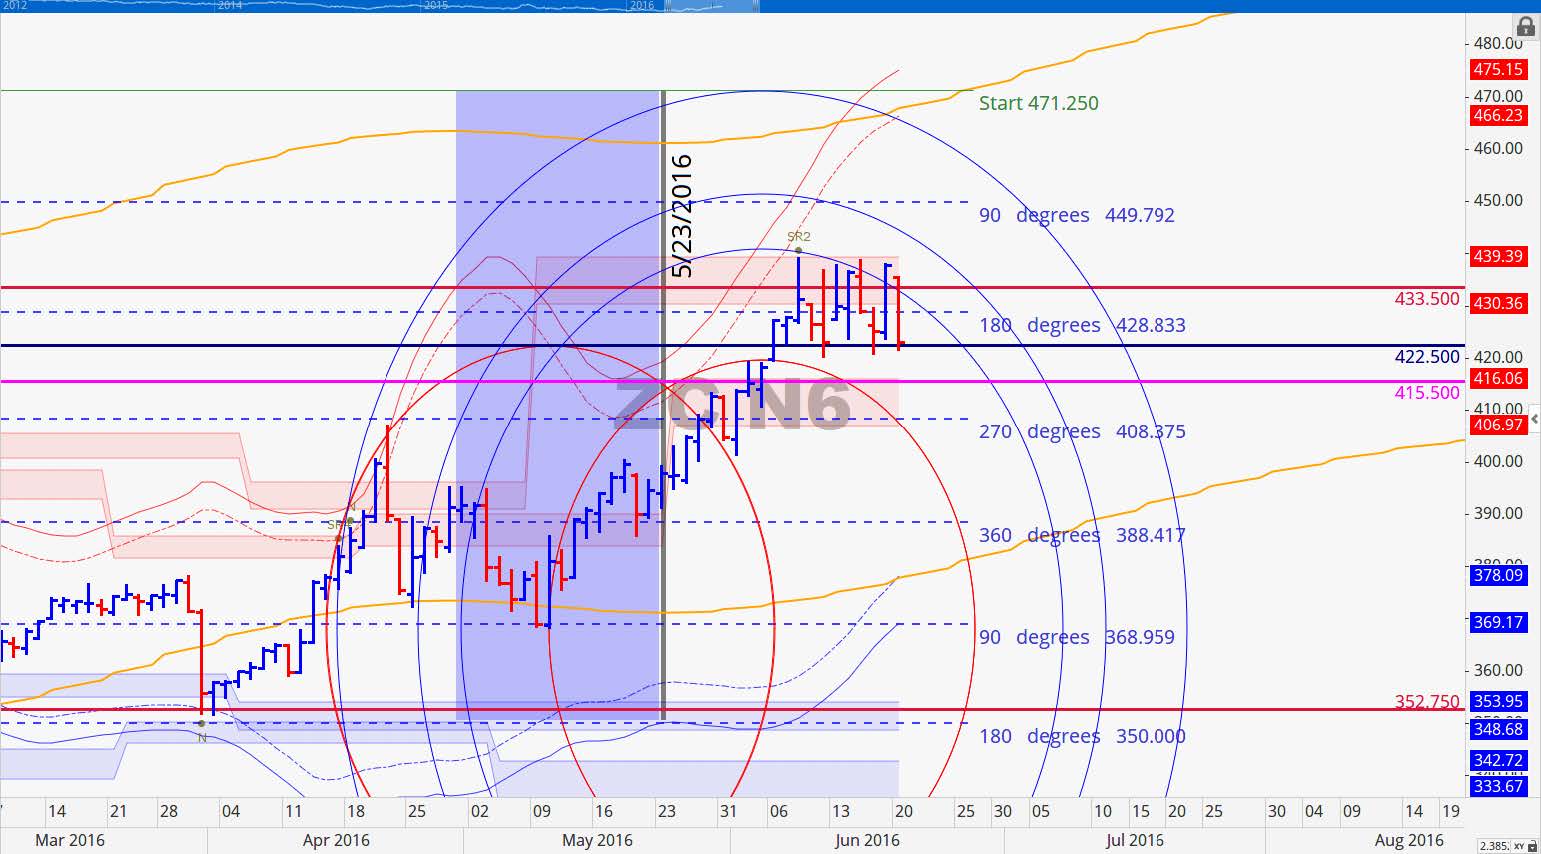
The point of control is still at 432.75 this week and by the look of trading early this week it could very well be key resistance this week. There is not much to glean here especially since we have 1st notice scheduled in 10 days. The blue dotted vertical line in the chart lands on June 27th and can be viewed as a potential minor turning point.
December 2016 Corn Charts
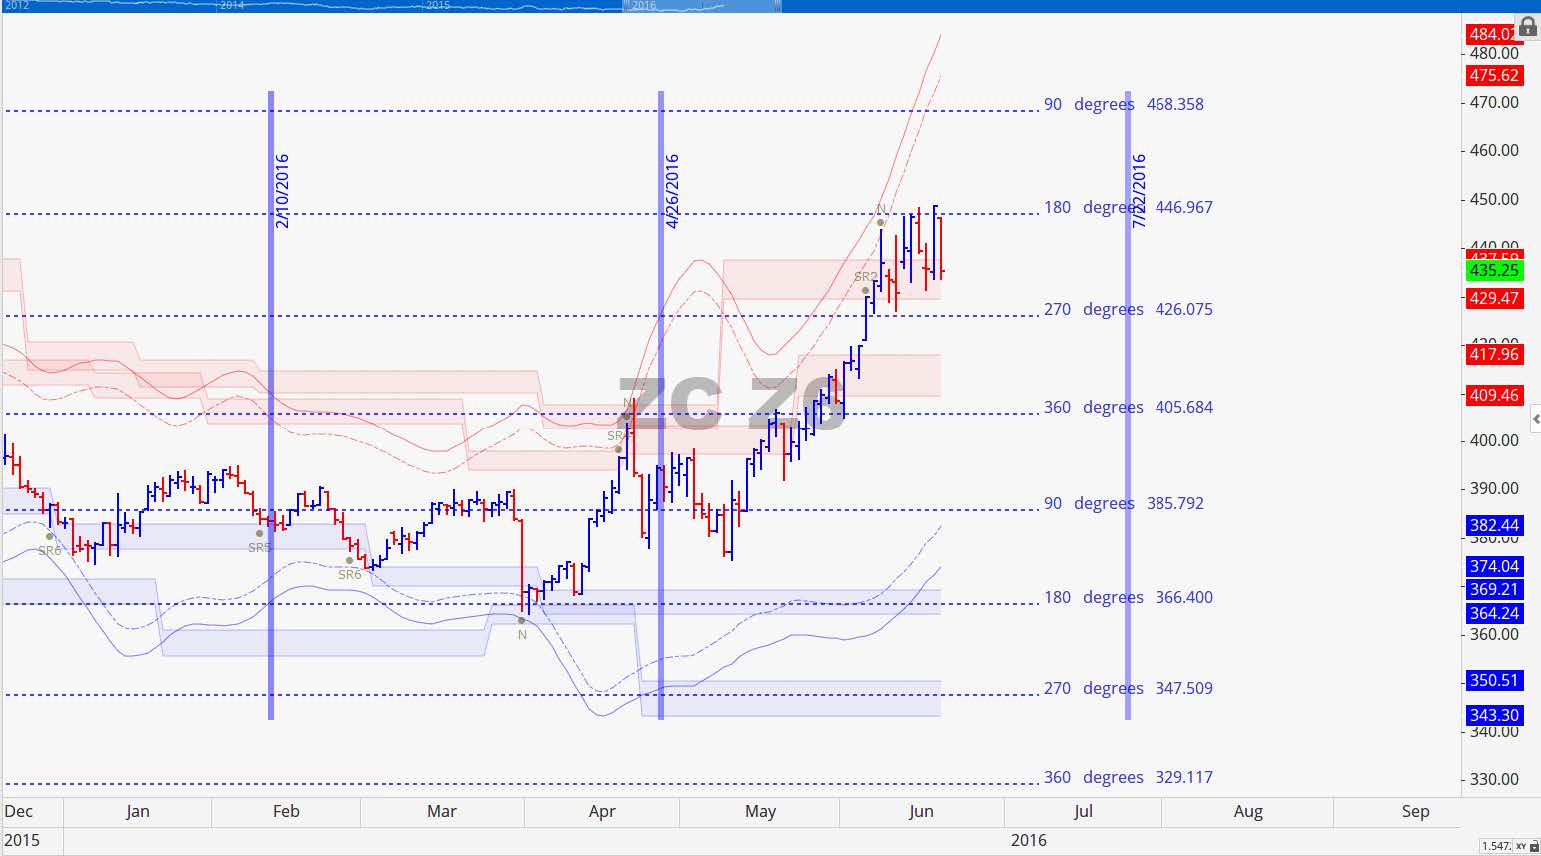
The December contract met overhead resistance at the 180 degree mark of 447 several times last week. Each time it met it reached this resistance point prices turned down. Just like last week look for it to be the important level of the week. If it is not able to close above this level this week at least twice the move down in Corn could very well start prior to the Independence holiday.
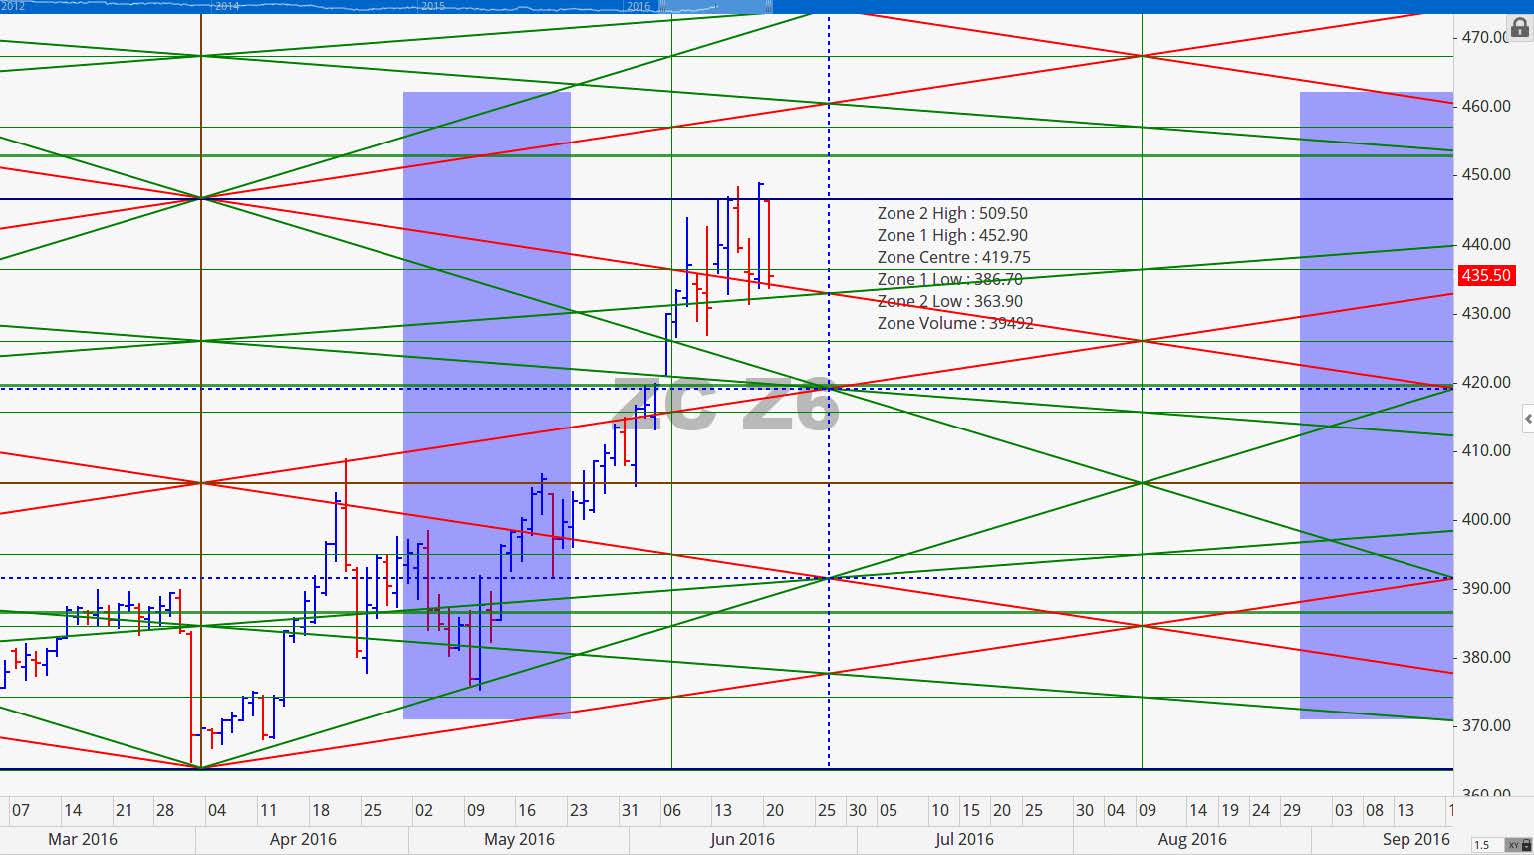
December Corn has its point of control level set squarely at 419.75. One level above is at 453 and one level below is at 386.75. We still believe that getting much higher than 455 will be a challenge for this contract outside of a major weather even which is possible. Once a summer top is confirmed a move down to 386 at a minimum looks realistic to us.
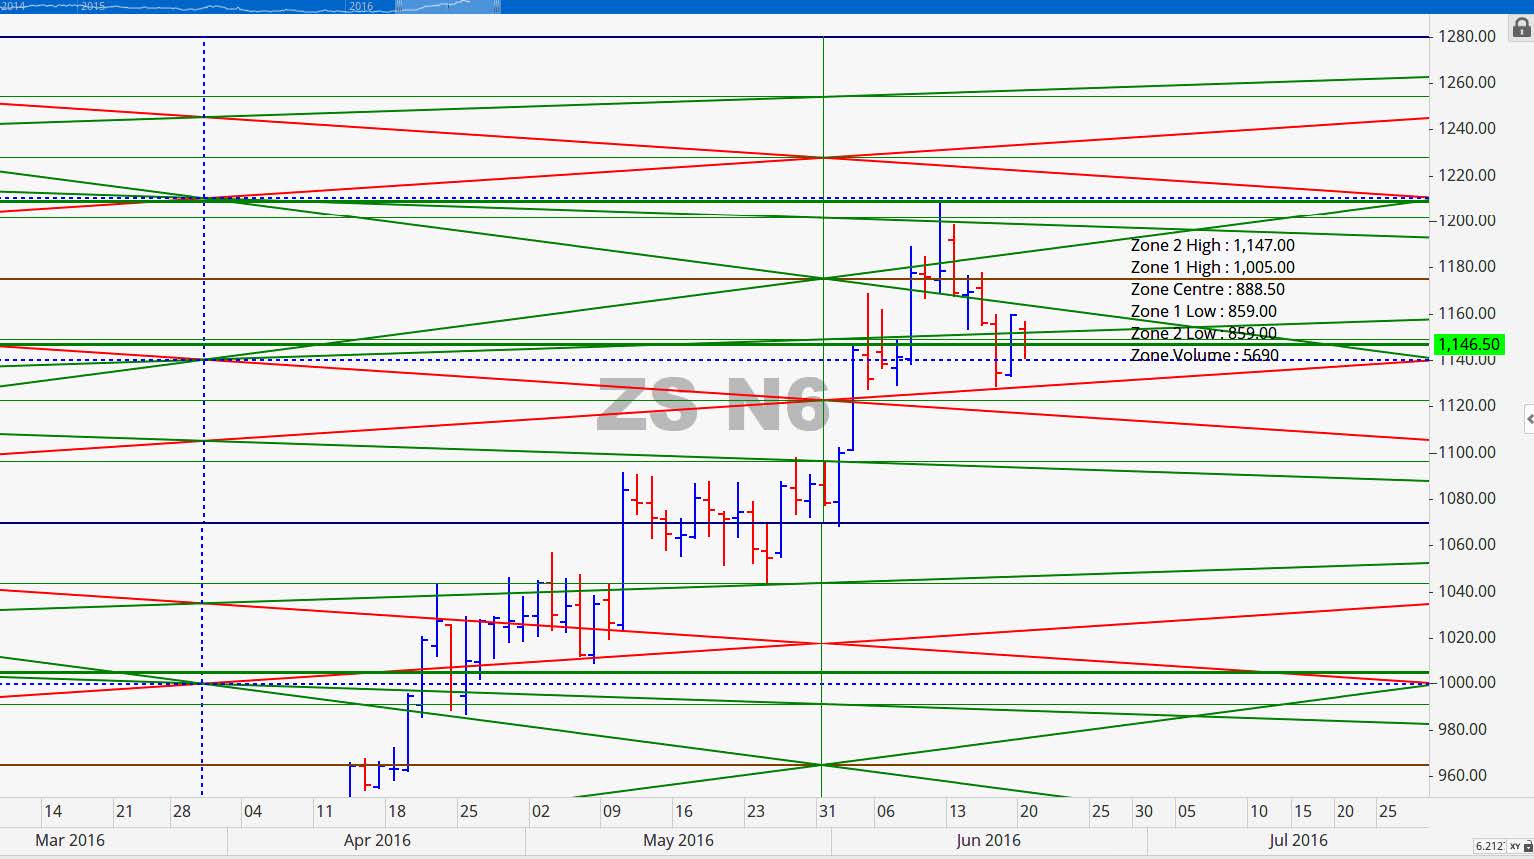
July 2016 Soybean Charts
For the July Beans last week we shared that key overhead resistance lived at 1212.25 with potential downside support at 1043.75. Both of these levels essentially bracket last week’s price action. Beans topped mid-month on June 10th and has not really been able to recover yet. Right now we are looking for prices to move down to sideway into the end of the month. The next key support level is at 1110 and that is the level to watch when the June 30th report is released.
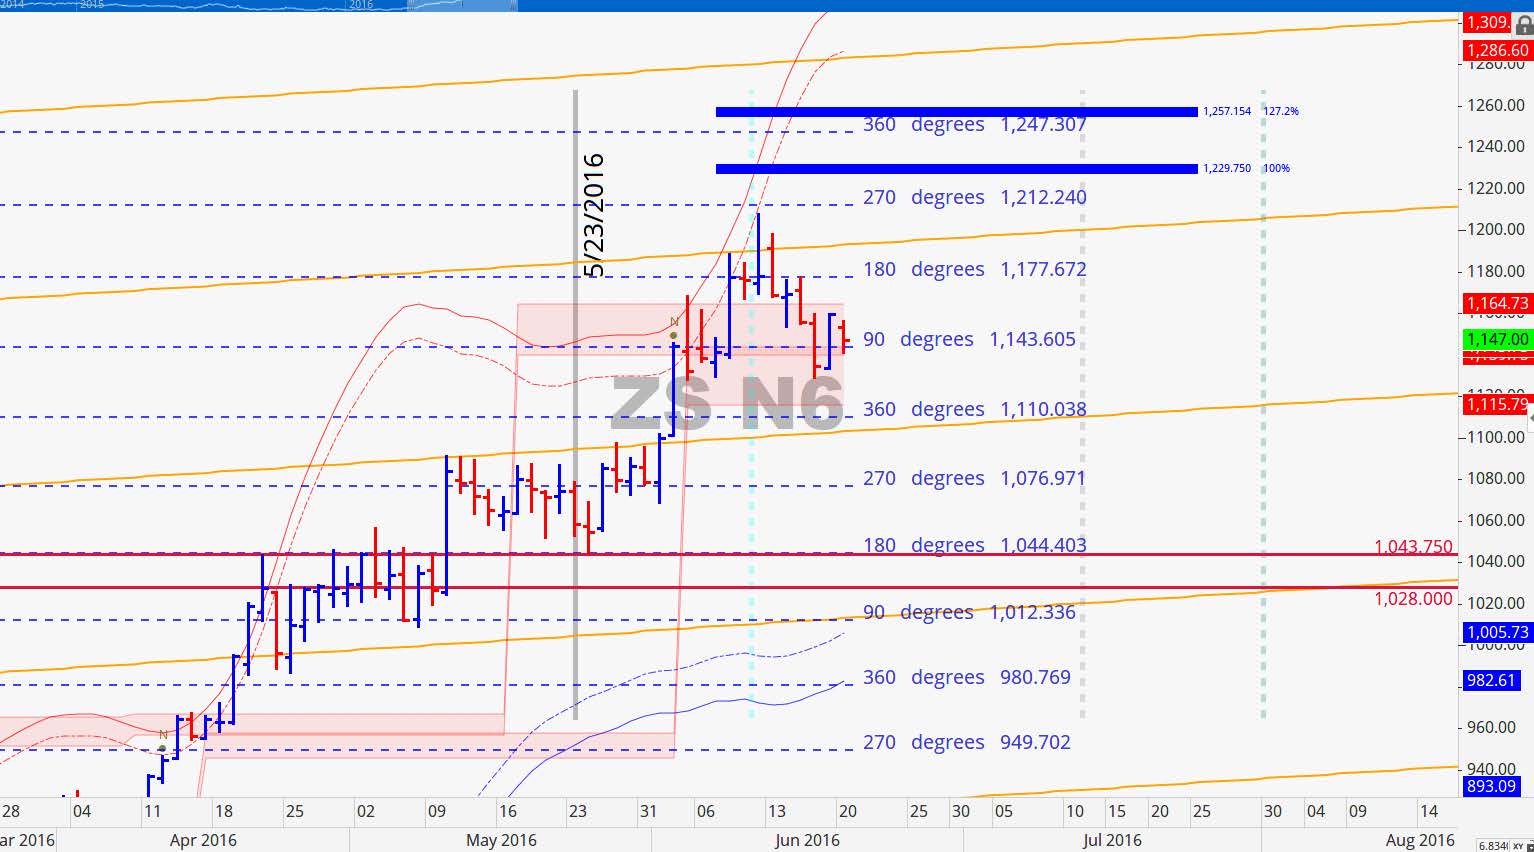
Two levels above the point of control is 1147 which is close to where prices look to close today. Last week we were not able to confirm that our projected top was in but within a few days the confirmation arrived and that top was right on time. This week we expected added pressure with traders rolling out of this contract to the next.
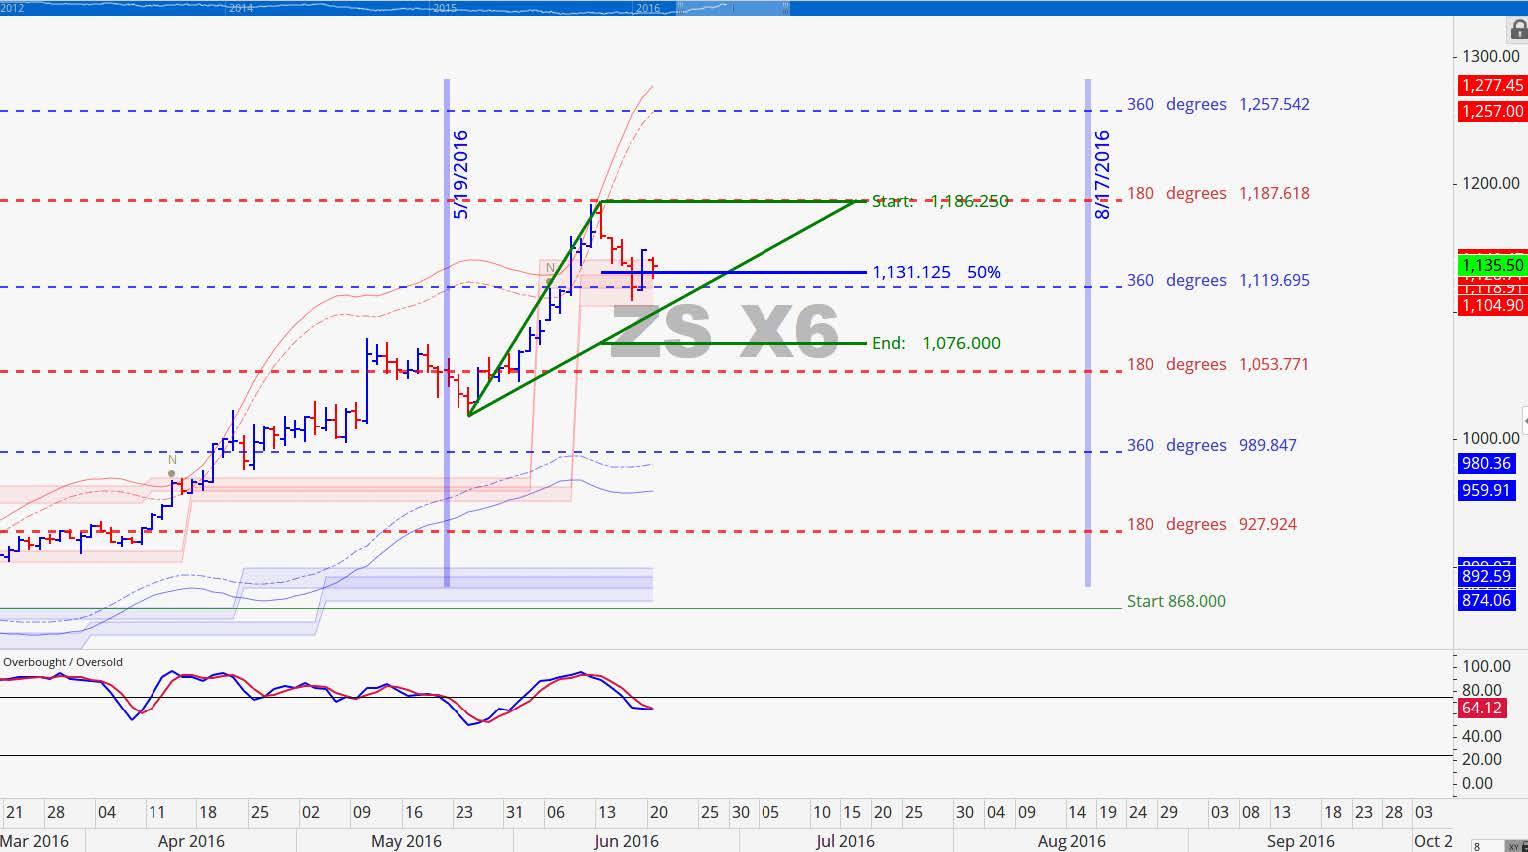
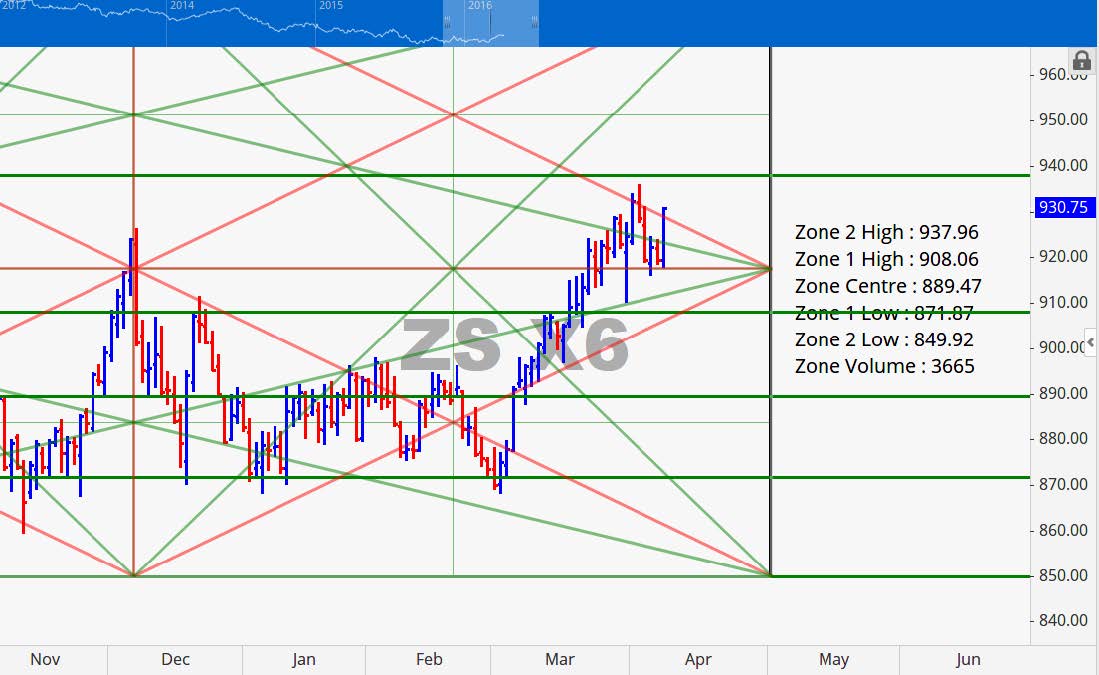
November 2016 Soybean Charts
Resistance at 1187.75 (180 degree mark) was key to this contract getting traction higher and it was not able to get above it last week. Once again this is the level that it need to clear to move higher. Last week we also shared that a break of 1119 would confirm additional weakness to come. Interestingly enough that is exactly one tic below the low of the week. We are going on record once again saying the 1119 looks to be a pivotal level for this contract this week. Look for support at 1076 in the event there are two days that close below a break of 1119 this week.
Grain Market Overview October 11
Read more