
Grain Market Overview July 13
July 13, 2016Grain Market Overview July 27
July 27, 2016Commodity Market News July 25

Summary
Corn and Soybean futures finished the last week in weak fashion but Wheat bucked the trend and managed to finish the week in positive territory. The much feared potential heat wave across the Corn Belt that was supposed to wreak havoc on the crops seems to have passed and significantly less threatening weather prevailed. Hot weather is still in the forecasts and we can never be presumptuous to assume conditions could not turn ugly late in the season but for now market participants appear to have conceded that this crop is going to be a very large one.
Evidence that fund managers and speculators have turned bearish has begun showing up. Managed money has been increasing their net short positions in Corn while at the same time reducing their net long exposure in both Corn and Soybeans. According to the most recent commitment of traders report, Soybean net long positions are at their lowest levels in just over three months. Last week's report showed that speculative net short Corn contracts were up 5 fold from 5,886 contract to 29,758 contract. The net long position in Soybeans moved from 128,813 contract down to 113,276 contracts.
Triple digit heat has been very much in play but rain fall in many of those hard hit areas has helped to mitigate would be crop damage. The extreme heat conditions are moving on and milder and cooler temperatures are projected for the next 7 to 10 days.
Grain exports should be back online in Argentina now that the grain truckers ended their strike following a settlement with the government over hauling rates. According to newswire reports the strike hit Corn exports particularly hard as there were few supplies at ports.
Wheat closed the week higher after garnering support from a 10% gain in the European Wheat markets. The Wheat gains in the US markets were not remotely close to that of the gains in the European markets but this could be a signal that the US Wheat market may have found a near term bottom from which it could move sideways and consolidate. US Wheat futures are still very close to multi year lows and will need to move up quite a bit before a true recovery would be considered to be in play.
Corn
September Corn ended the week down 17.25 cents (4.9%). December Corn finished down 16.50 cents (4.61%). The hot topic over the past week has been the weather. Both contracts reached life of contract lows when the feared damaging heat never showed up as anticipated. Additionally, export sales were underwhelming coming in at 13.6 million bushels of old crop and just shy of 20 million bushels for the new crop. US crops continue to be in competition with the Black Sea region where their Corn and Wheat feed offering has made it very tough for the US to compete with their cheap prices.
Given all of the bearish fanfare the US market will probably make a bottom soon. That bottom could occur near the end of July or the beginning of August according to our market cycles. From there we would look for the Corn market to trade in a churning sideways fashion through the end of August and possibly through September. This potentially is an opportunity to sell premium when it makes advances toward resistance.
Soybeans
Soybean futures responded more intensely to the non-factor weather events than Corn did. September Beans lost 66.75 cents (6.26%) and November Beans surrendered 69.25 cents (6.55%). Both contracts broke below the 10.00 mark and both hit key downside minimum price objectives that we outlined in last week's newsletter. New crop sales helped to push export sales past trade expectations with new crop at 36.8 million bushels and old crop coming in just shy of 12 million bushels. It is anticipated that there will be a sizable rollover from old crop to the new crop. Soybean futures have been trading as would be expected.
On the charts the consecutive lower highs pattern that developed was an indication that sellers were stepping down their limit orders. The main trend looks to continue to remain down and managed money still has quite a bit of inventory to unload. We expect to see continued selling pressure on pullback rallies.
Wheat
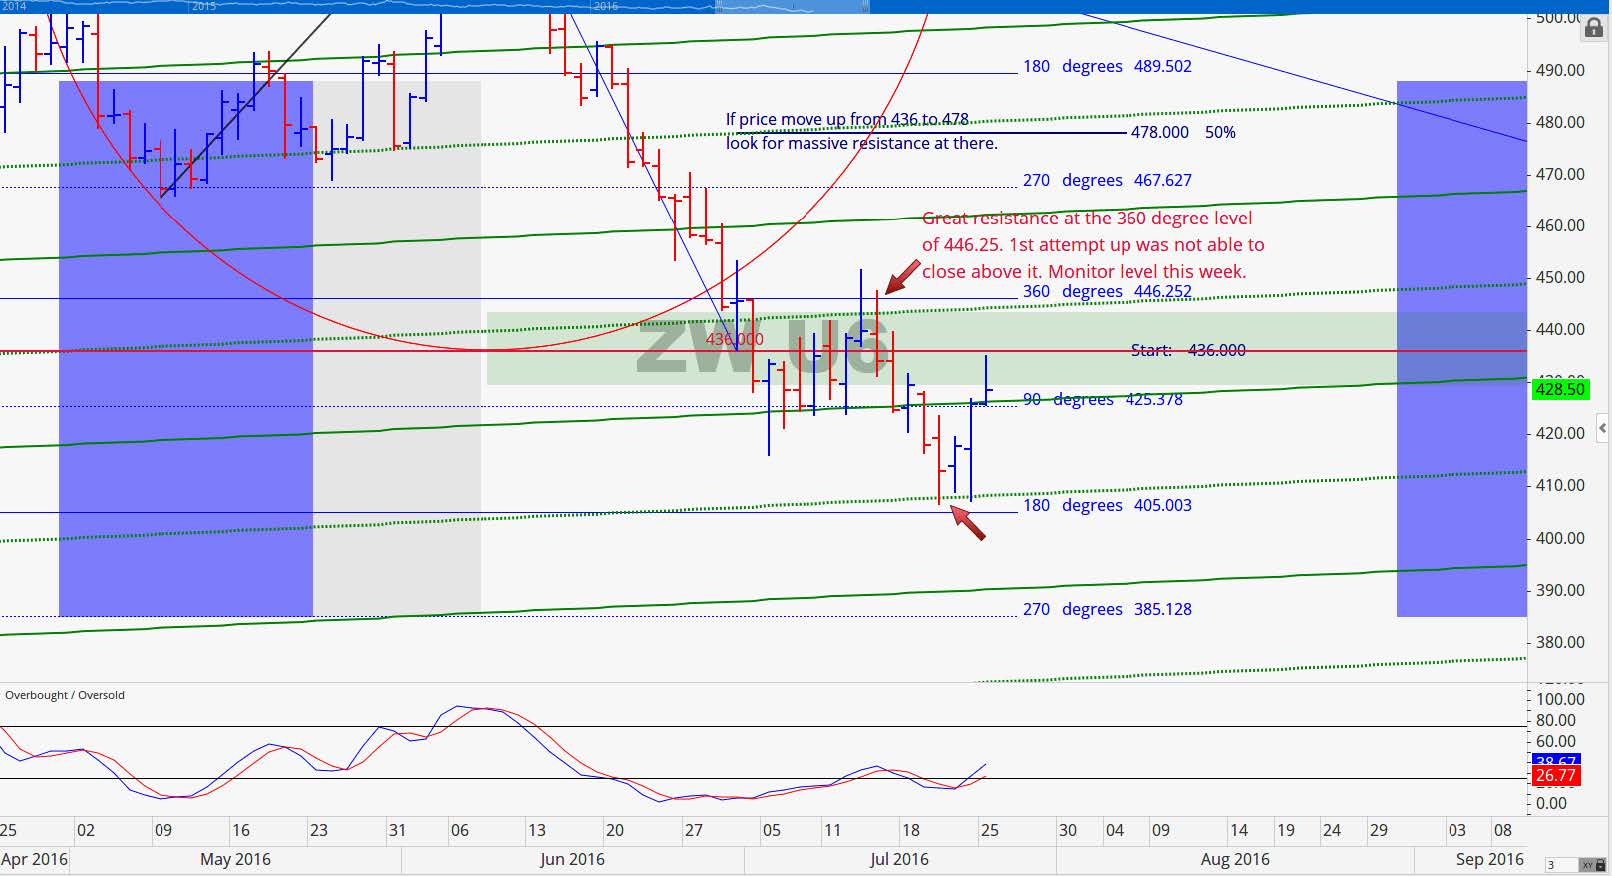
September Wheat took a breather last week and reversed off of its lows finishing the week up 0.50 cents (0.12%). The September contract traded past its life of contact lows and is in dire need of good and bullish news to find a way to hold support. Most of the week was spent trading at or near contact lows and was only able to make a push because of news out of Europe. The strong US Dollar and plentiful inventory looks to continue to plague Wheat futures.
As of last week just over 3/4 of the Winter Wheat harvest has been harvested after being hampered a bit by some rain and hail storms. Spring Wheat harvest is only a few weeks away. The annual Wheat Quality Council's Spring Wheat tour is set to kick off next week. Crop scouts will be checking fields in Minnesota, North & South Dakota. According to CFTC reports managed money is still carrying over 100k net short contract positions. Price stability will occur once they begin covering. In the July 12th report, the USDA projected record yields for Wheat estimates. The trade believes that the number may be even better depending on what happens with Spring Wheat in the northern Plains. Outside of a huge rally in Soybeans, the bigger than expected crop points to even lower prices ahead.
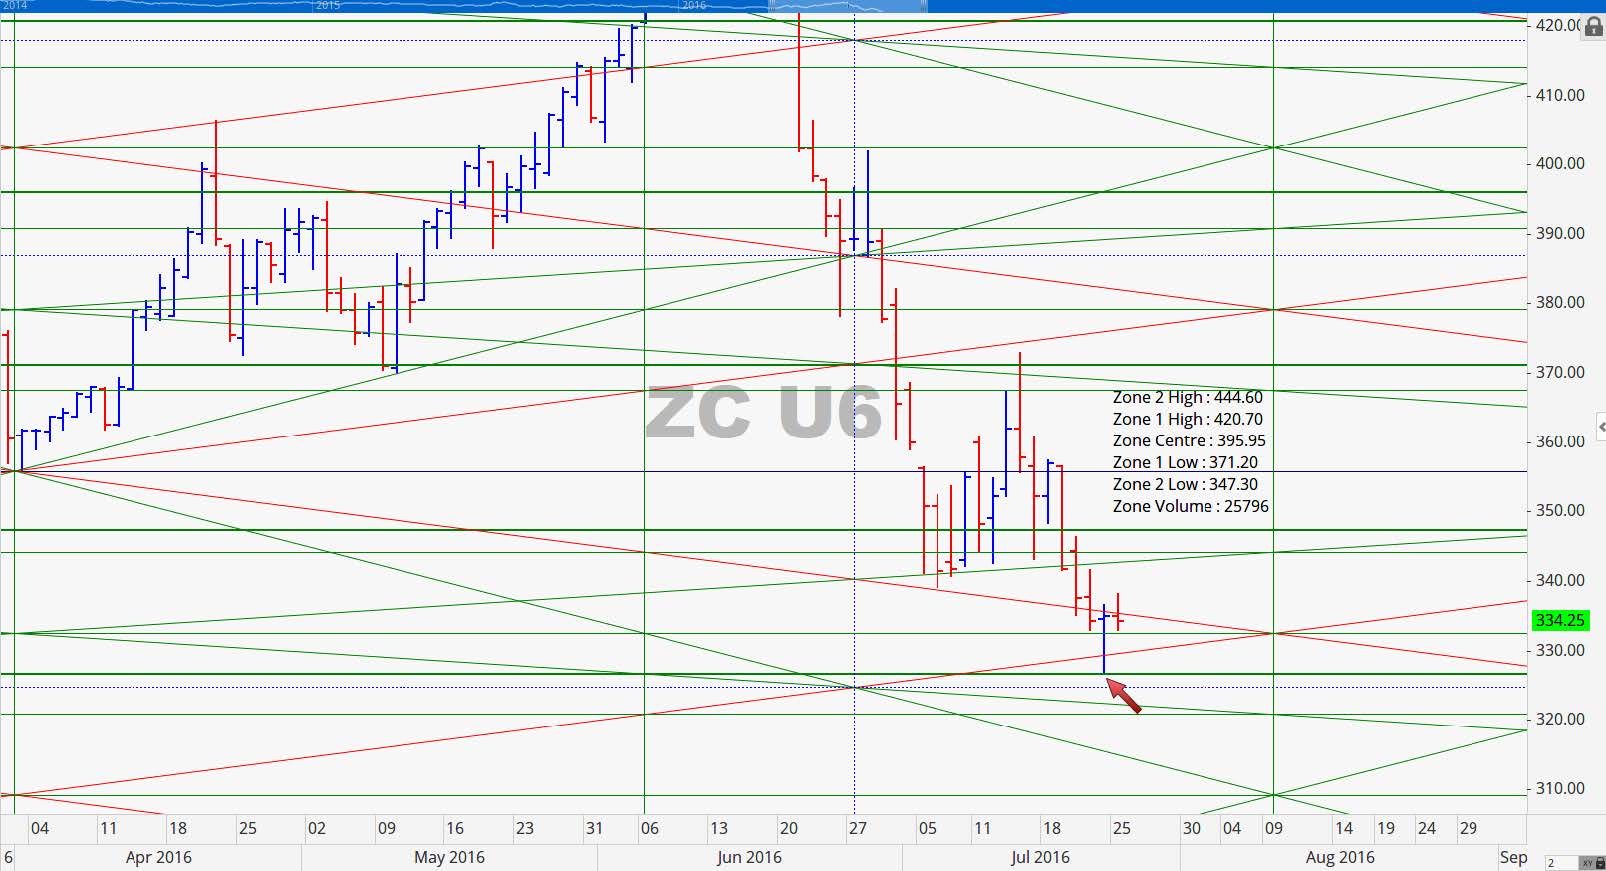
September 2016 Corn Charts
Once the September contract was able to close below our natural support line, price raced down to our 336 targeted price point. This week the operative level of importance is 318. If this contact does not close below 318 through the August 2nd that level could prove to hold until this contract comes off the board. Below 318 the potential key support level would move to 300.50 and we believe that this contract will have a very tough time of getting past 300. Last week's price action proved to respect our 336 price point very well. Price traded down through it only to return and close to that level at the end of the week. We like the timeline of August 2nd as a confirmation point that the down draft has come to an end.
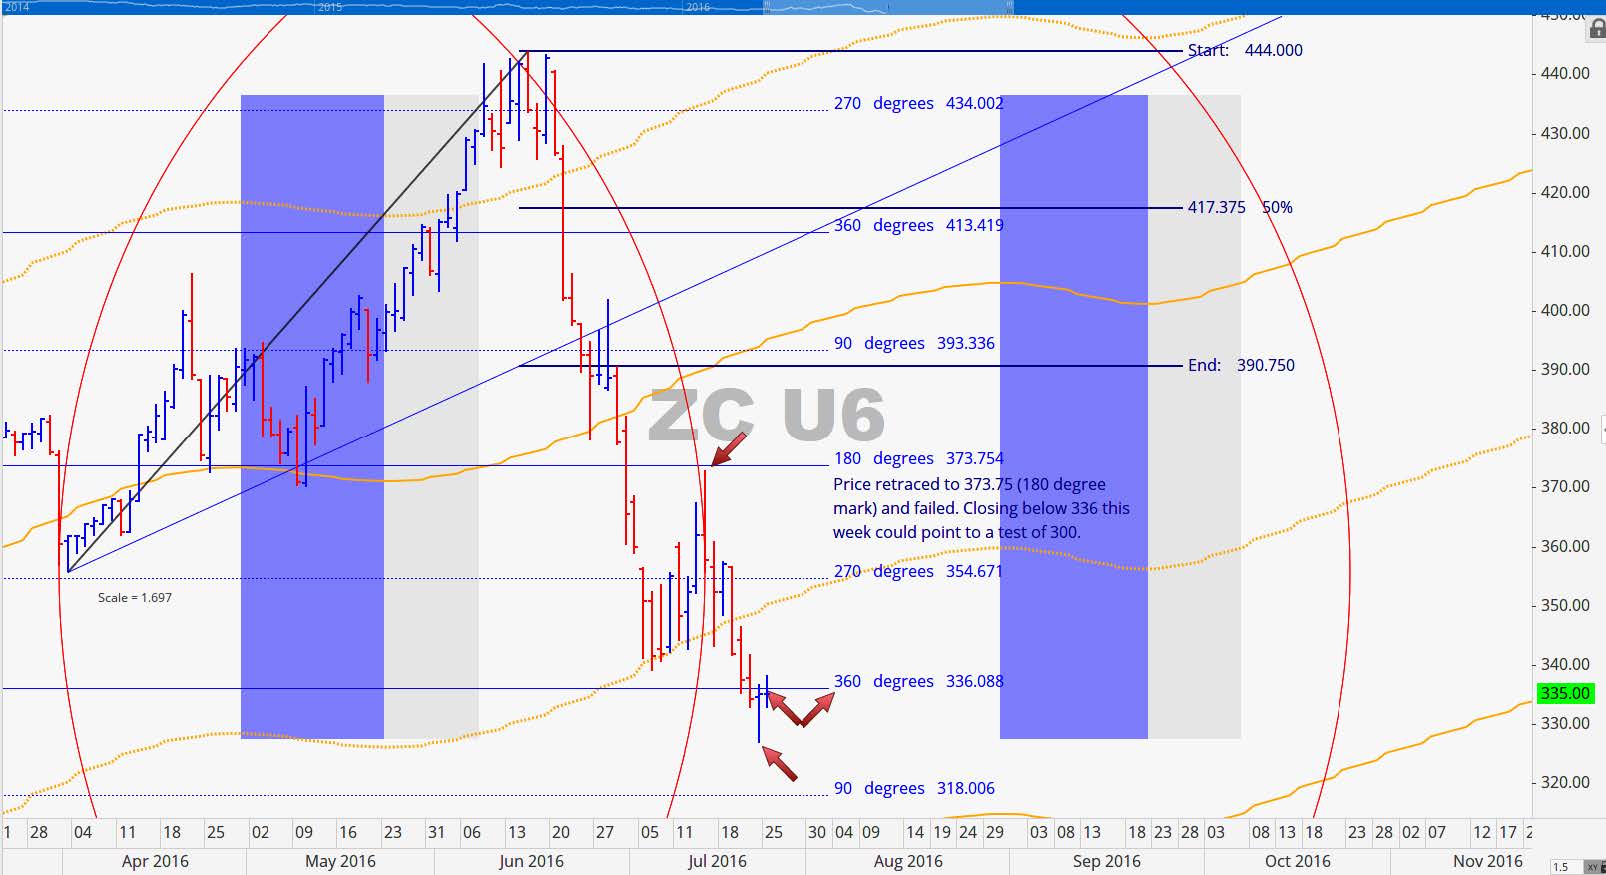
The point of control level of 396 has been holding steady for several week now. The low from last week rests at a natural quartile division. Closing below last week's low either today or Tuesday would be an indication of selling pressure to follow but either 318 or 300 should hold up. Overhead resistance is at 347 this week, a couple levels below the point of control. After the August 2nd time factor we have August 9th -10th as window for a small market turn. It is marked off as a green vertical line on the chart below.
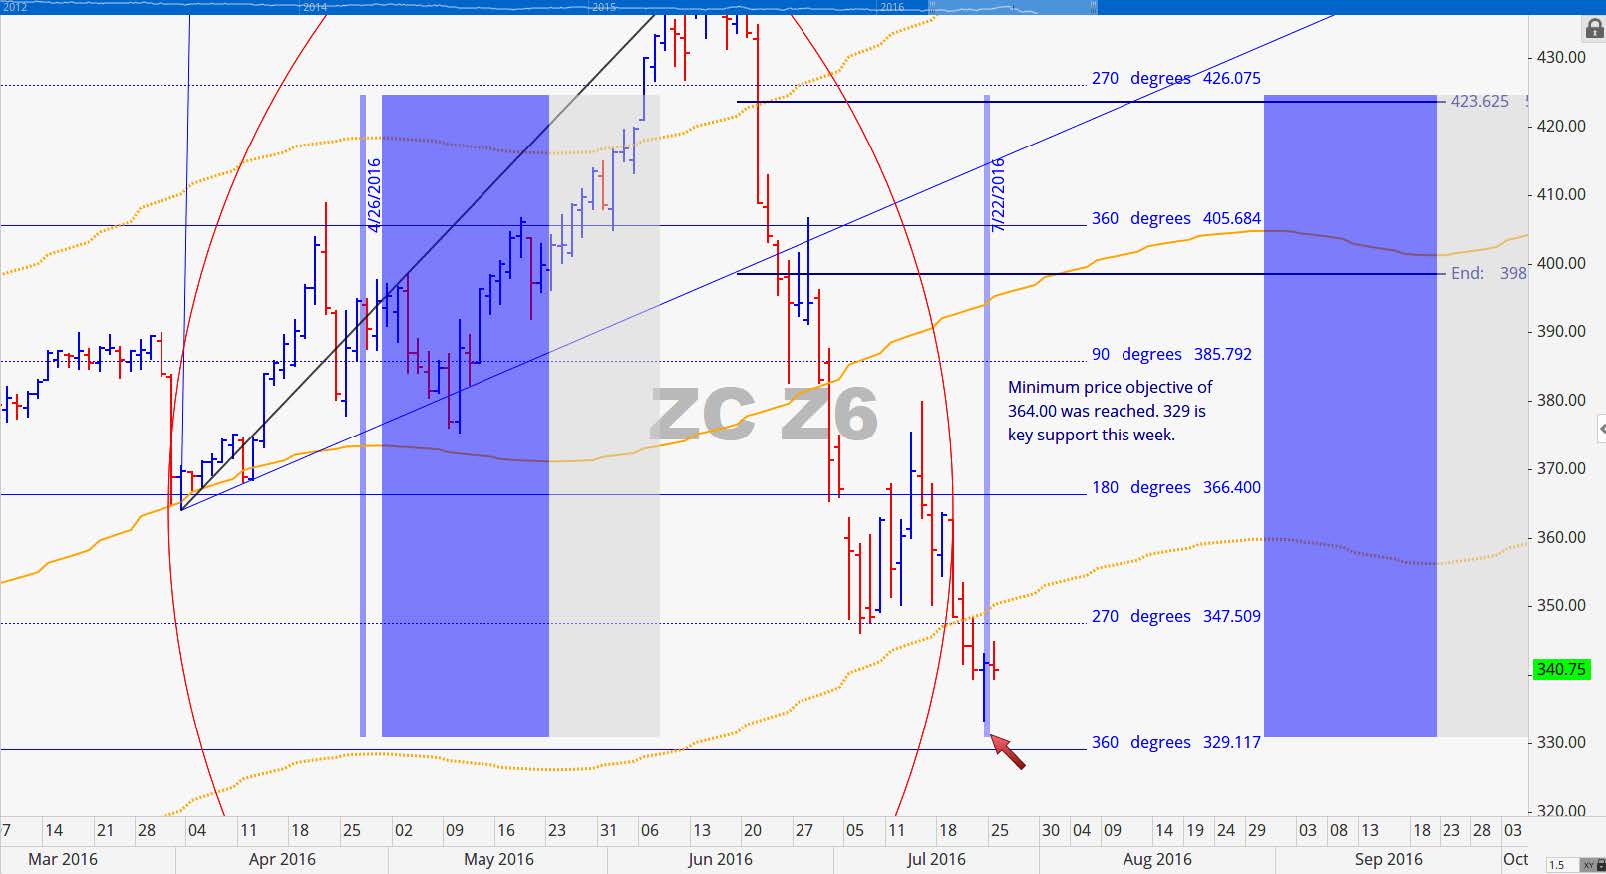
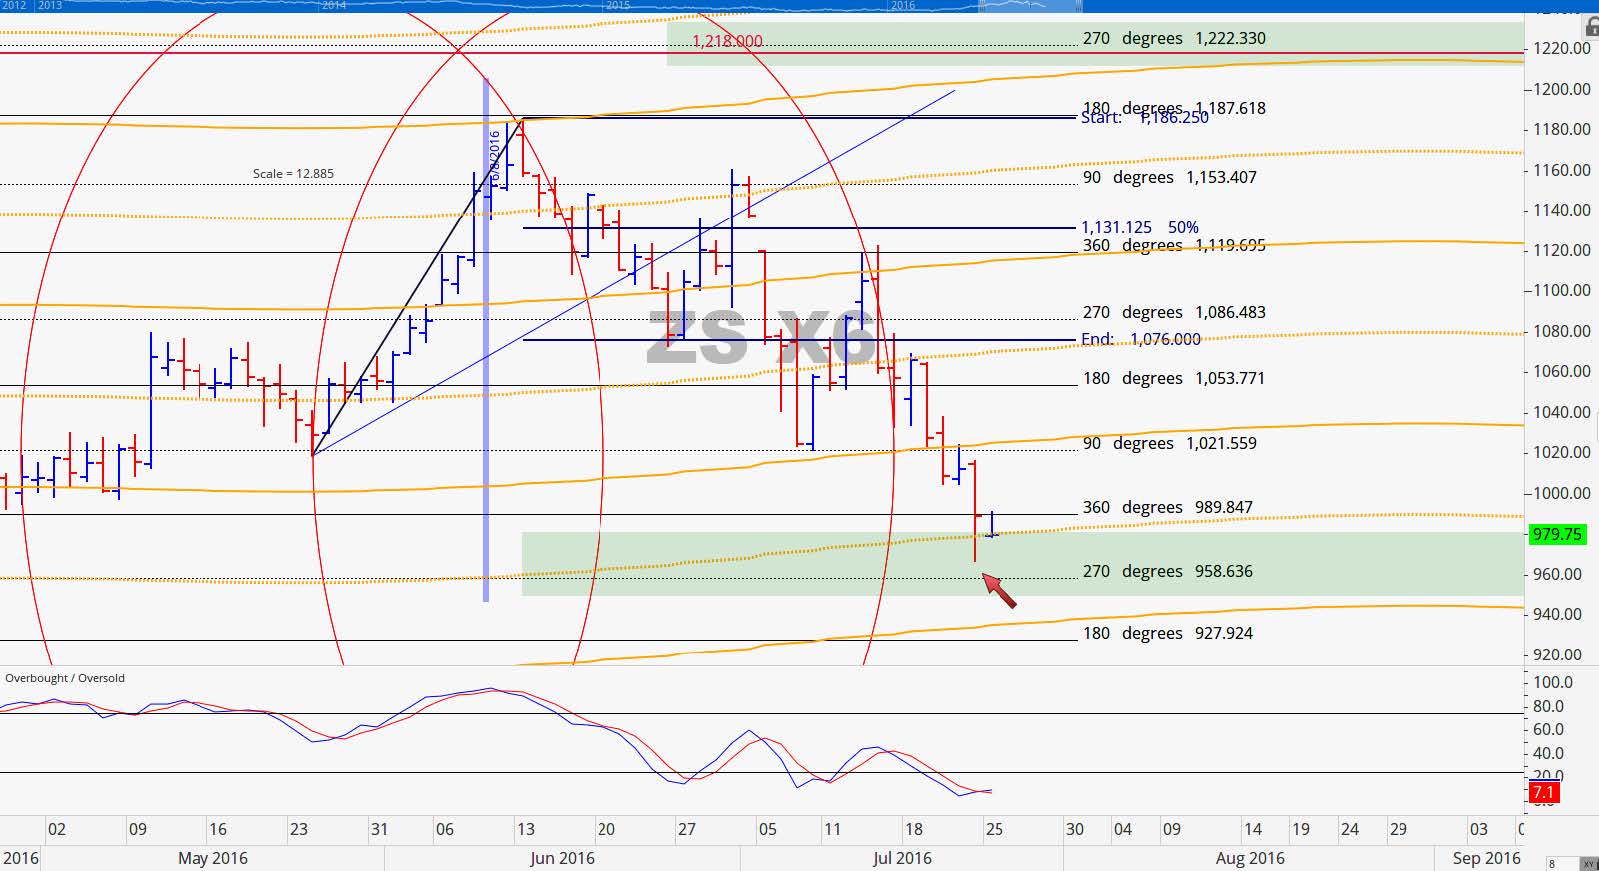
December 2016 Corn Charts
Last week we shared that the December Corn contact had a near term cycle turn date of July 22nd. The contract made a big low on that day but also had a very strong reaction off of that low as would be expected for a potent turn date. One day does not make for a turn but the reaction on that projected turn date was impressive. This week resistance at 347.50 and support at 329 are two important levels to monitor. Once the market was able to get past the 347.50 (270 degree mark) it made a move to the all-important 360 degree level. If Friday's low holds this week then our July 22nd turn date will have been confirmed.
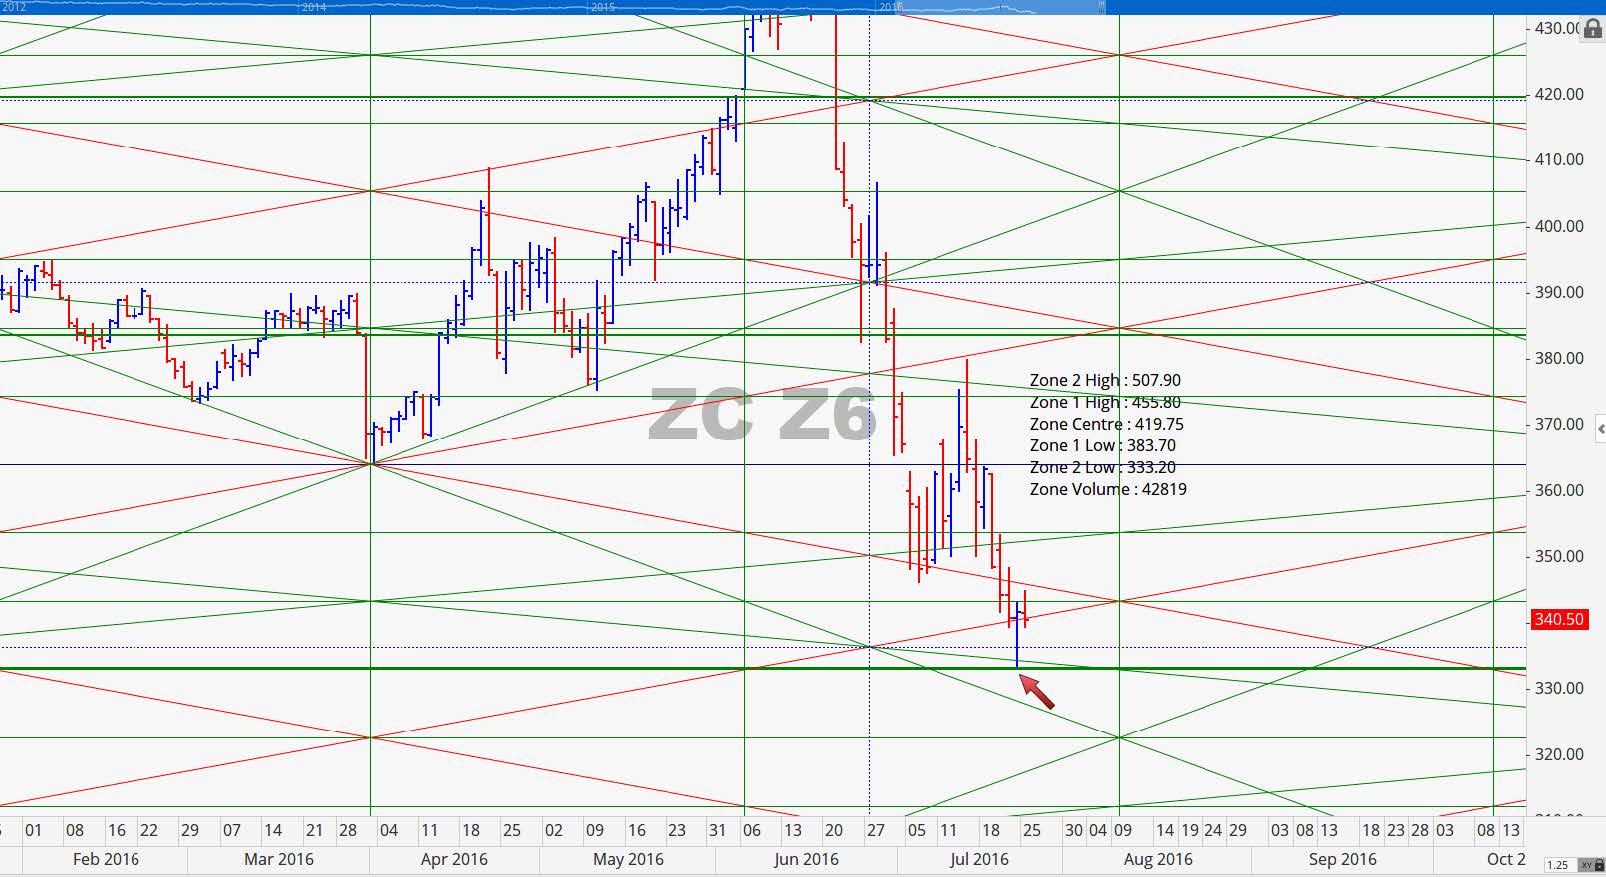
The December Corn contract tagged the level that is 2 standard deviations below the point of control at 333.25. Breaking below would confirm weakness and holding above would suggest a bit of stabilization in prices. The next level is a long ways off at 383.75 so instead look for resistance at the 353.50 quartile level.
September 2016 Soybean Charts
September Beans moved with exact precision last week. Our target area was highlighted in green with 979 right in the middle of it. In the chart you will notice that the 360 degree mark coincided with a natural support line (dotted line). When the price met those two levels at the same time the market paused and reversed in text book fashion. Given the way in which the price pattern is developing we are looking at a price objective of 917.50 as very probable. Key resistance this week is at 1042.50 and support at 917.50. Below 917 we could get down to 887.50.
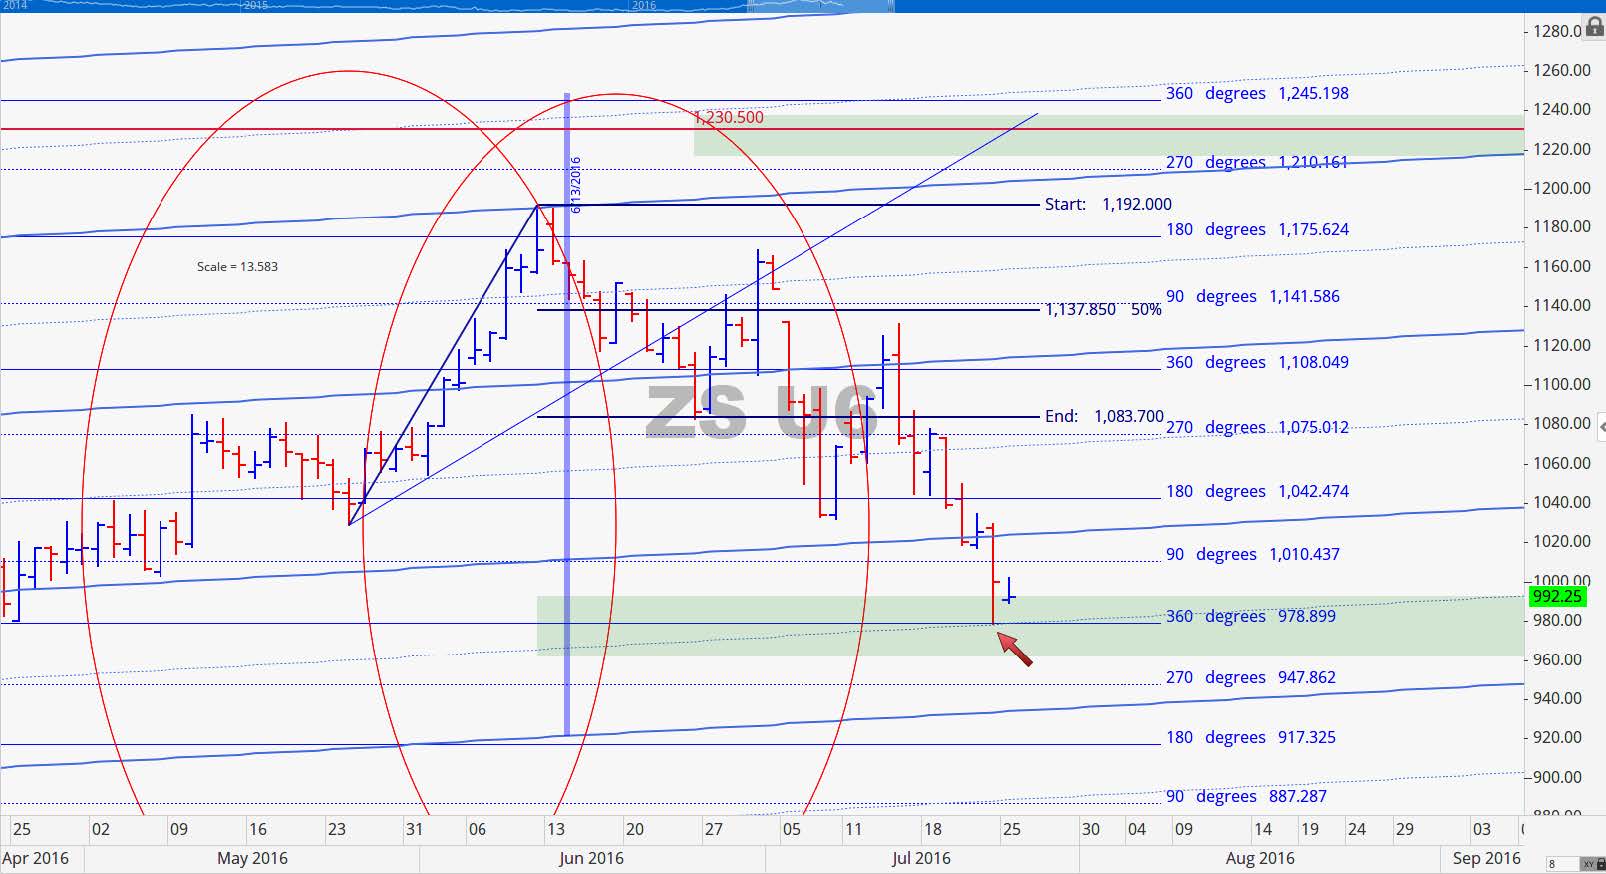
Last week we suggested that a close below 1030 would push the odds in favor of this contract reaching 889.50 before coming off the board. After closing below 1030, 889.50 is looking more and more probable. The near term quartile level of 950 is what we suggest monitoring this week for the September Beans contract.
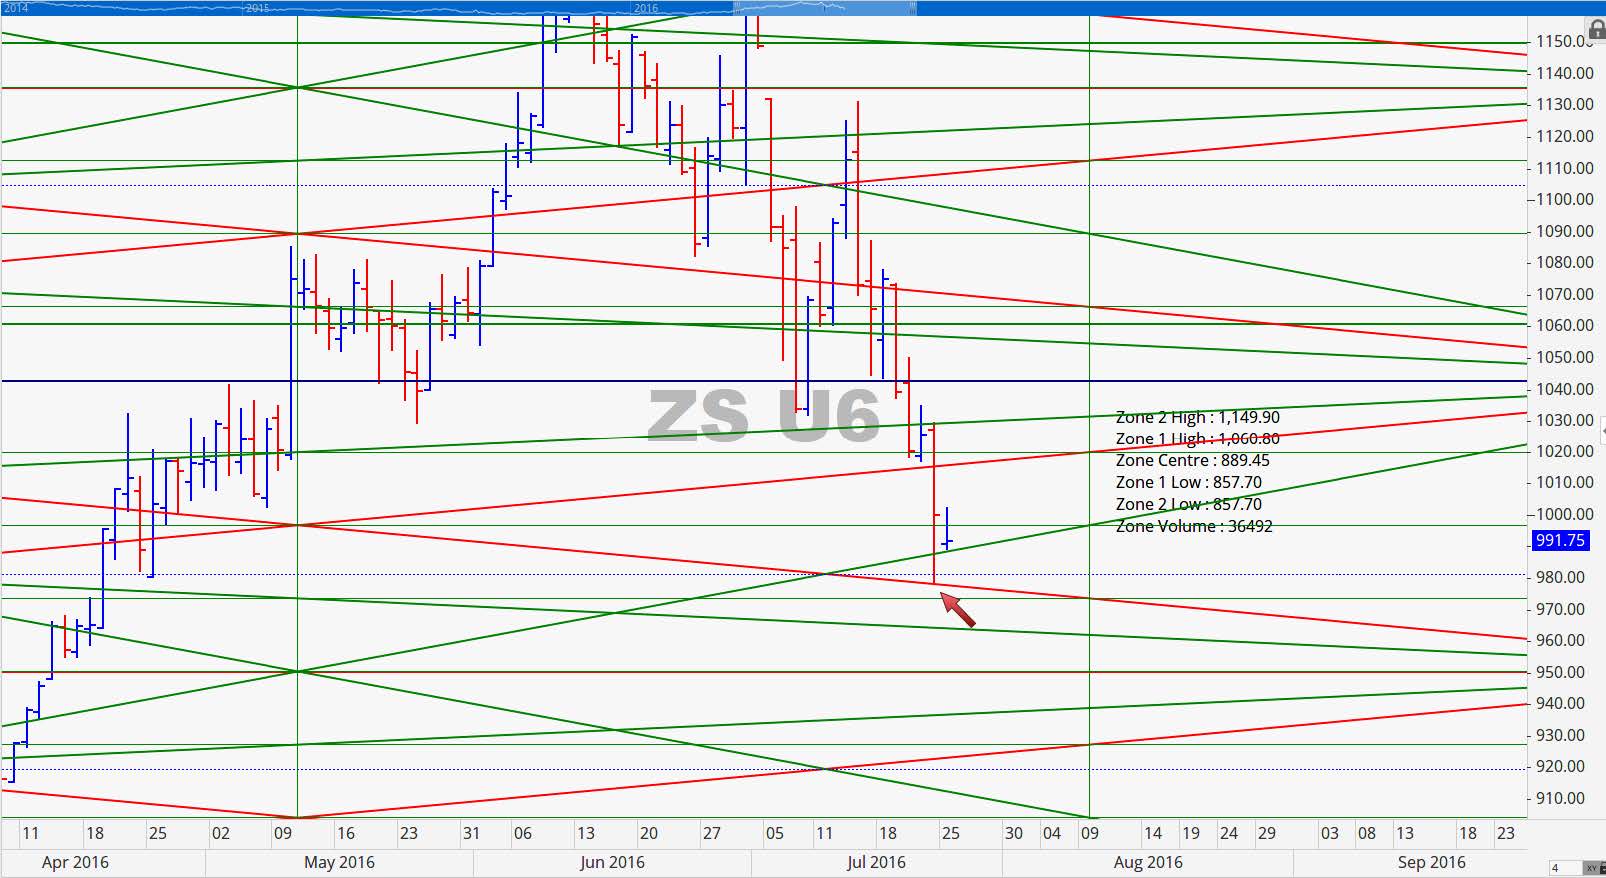
November 2016 Soybean Charts
November Beans is poised to reach 958.75 or even 928 very early in the week. A move down to 928 would complete two full cycles from the 1186.25 high. Our discussion last week on the markets propensity to move in full cycle rotations is playing out as seen on the charts. The close on Friday was at 989. That was in line with our commentary last week stating, "If history would have its way then we are looking at a potential terminal move at the 990 area."
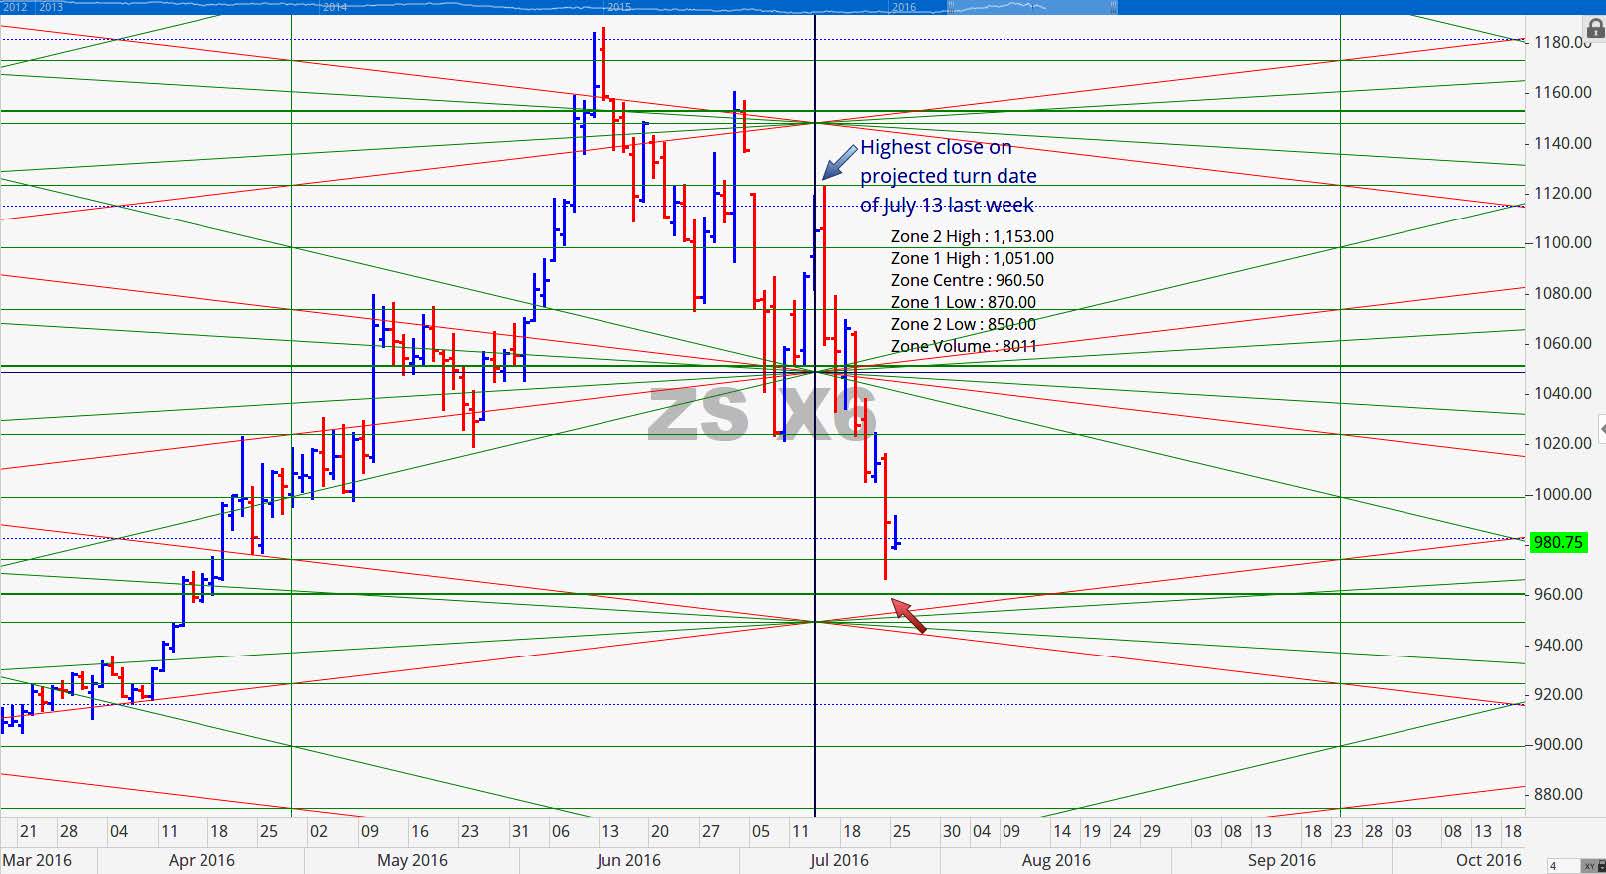
Grain Market Overview October 11
Read more