
Grain Market Overview June 29
June 29, 2016Grain Market Overview July 13
July 13, 2016Commodity Market News July 12

Summary
Back in the news but flying somewhat under the radar is the GMO Labeling Law debate. The Senate approved a compromise on GMO disclosure standards at the end of last week on Thursday. In doing so the House is poised to shut down Vermont’s labeling mandate that was made effective on July 1st. Industry Lobbyist are busy at work trying get House leaders to allow a vote on the bill this week before lawmakers break for the national party conventions and their August recess. The House must vote on the measure before the vote can go to President Obama for his signature. The labeling debate has exposed a divide over the future of biotechnology in agriculture.
What a difference a week makes. Just two days before the USDA quarterly report on June 28th, according to the Commitment of Traders report, net fund ownership of Corn, Chicago Wheat, Kansas City Wheat and Soybeans was at $29.1 Billion dollars. That was a year over year increase of 32% when it was reported. Two days later the USDA report was released. Then after the Independence Day holiday on July 5th, net fund ownership of those same commodities was reported $5 Billion dollars lower at $24.1 Billion and was also down 2% year over year. This should come as no surprise given the magnitude of the grain and oilseed market declines last week. This massive decline was perfectly in line with our forecasts calling for the end of June to early July timeline to be a potential pivotal turning point in the price action.
Last week, the prospect of favorable weather conditions and the USDA’s report showing that Soybean crops continued to mostly be in the good to excellent category added to the pricing pressure that Soybean futures suffered last week. Improved soil moisture was the result of rainfall in parts of Iowa, Illinois and Nebraska. The current good to excellent rating sits at about 70% percent for this time which is historically high.
Kansas City Wheat is experiencing record high yields which in turn has pushed Wheat futures to level last seen almost 10 years ago. Some harvest reports are in the range of 50 to 70 bushels per acre blowing away area averages. During this time of the harvest last year the good or excellent rating was only at 40% this year the rating is at 62%. The rainfall this past Spring really made a difference this year.
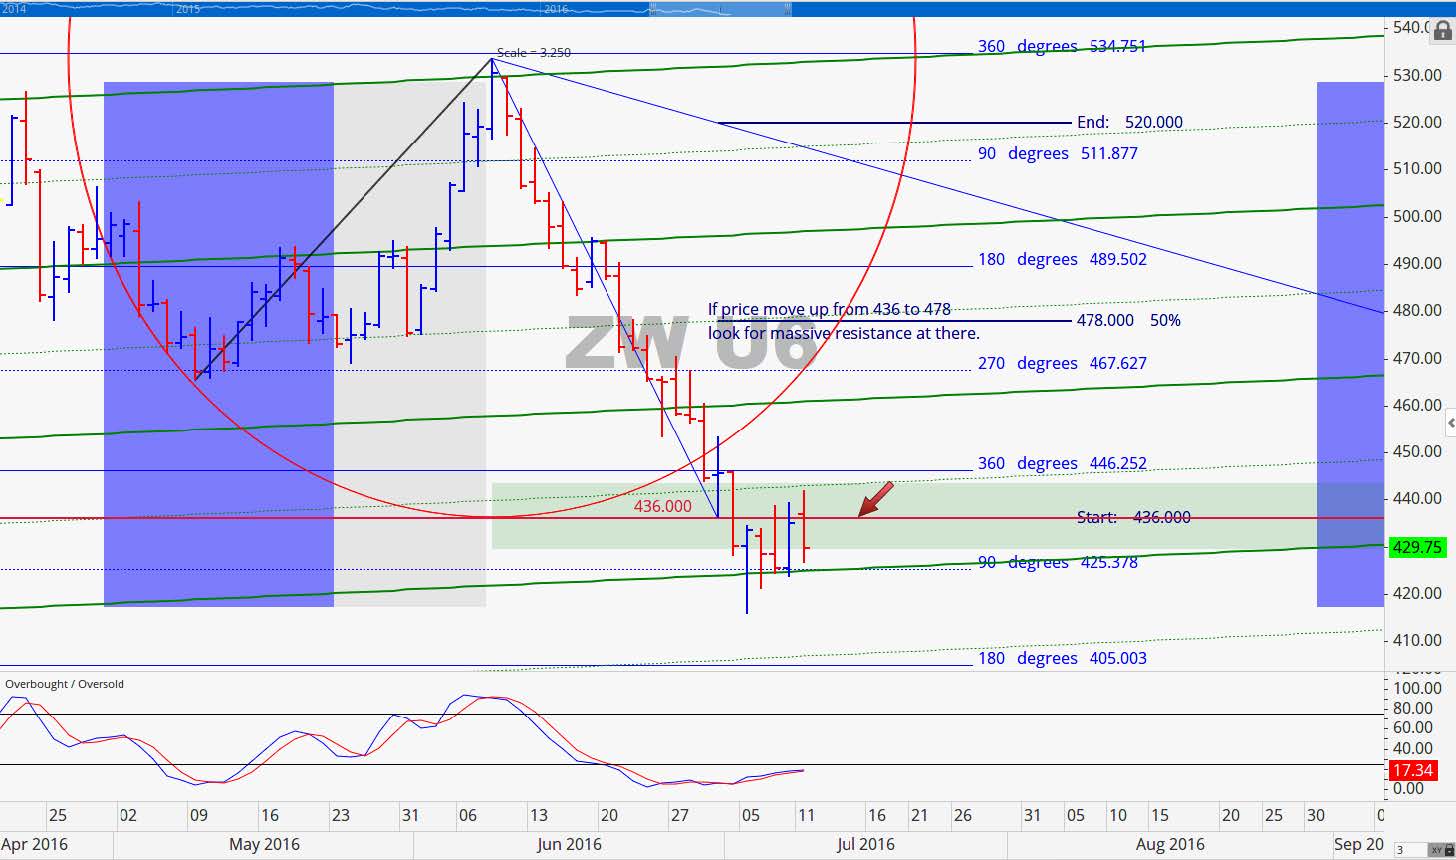
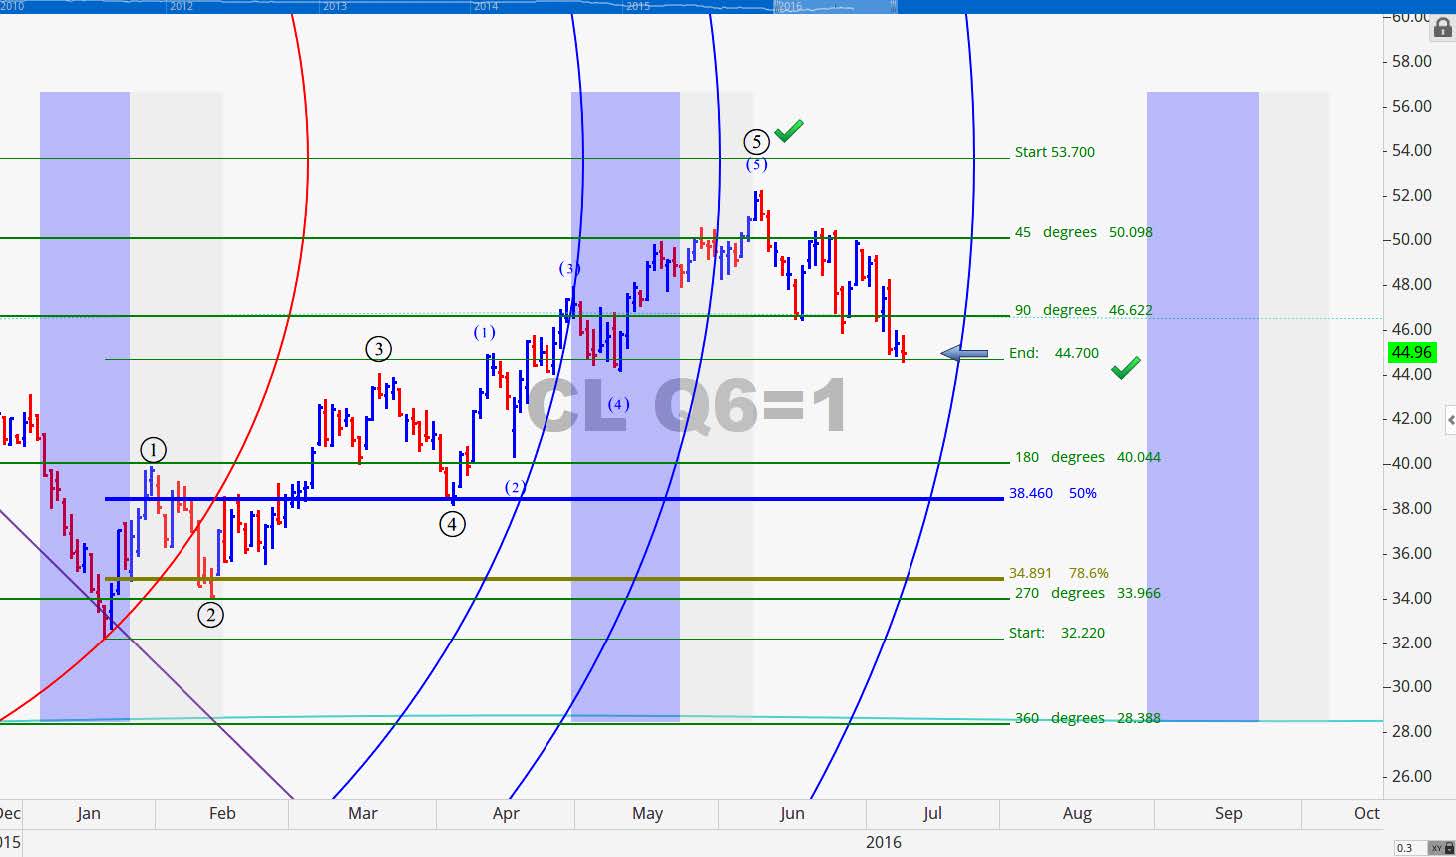
Just below the 2604 resistance level for the CRB Index is the resistance at 2525.50. A weekly close above this price would be the first indication of a possible move up for the commodity complex until then we are looking for sideways to lower prices. The price level at which fund ownership might venture to increase their bets to the long side would be above 2666.25. We will take a look at the Crude Oil August contract later in the newsletter but it is worth mentioning that the minimum price objective of 44.70 was reached today.

The Quarterly USDA Grain Stocks report delivered on being the month end market catalyst that we were looking for. With a history of setting the tone for the summer months the report set the stage for a major summer top that still has not found strong support yet.
Corn
Corn futures continue to be in a weaker position than Soybean futures as evidenced in the technical charts. Additionally the Corn crop looks like it wants to just keep getting bigger and bigger. The weather has been very favorable and the planted Corn acreage sits at 94.1 million acres. Last week September Corn was down 1.39% but the prior week it was down 7.46% and just over 12% the week before that. The November contract experienced similar percentage drops. Only 5% of the crop was reported in the poor or very poor category which is unchanged from last week. We referenced earlier that fund ownership had exited some of their long positions. We anticipate that Managed money will continue to liquidate long positions and even add some short positions. In our last newsletter we warned you “current market cycles that essentially pointed toward a persistent decline into early August”. We are witnessing these cycles coming to fruition
Soybeans
September Beans were down 6.99% (80.25 cents) last week but was up 5.75% (62.50 cents) the prior week. The week before that it was down about 5%. The November contract also moved in a similar fashion. Unlike Corn that has been down pretty persistently Soybean has not been as week. Managed Money that had already started liquidating Corn started to liquidate Soybeans as well and began increasing their short position. The price action over the past three weeks is consistent with the seasonal volatility that we forecasted in prior newsletters. The weather outlook so far has been favorable for the Soybean crop over the next couple of weeks. The crop condition saw a slight decline from 5% to 7% in the poor or very poor category. Beans were somewhat subdued today ahead of the WASDE report scheduled for tomorrow.
Wheat
September Wheat rose 1.10% last week but suffered declines of 7.47%, 60.1% and 2.37% in the three prior consecutive weeks. It was also weaker again today. The early part of the marketing year for Wheat opened with strong export sales and good inspections. Inspections came in at over 500,000 tons for the 3rd time over the first 5 weeks of the new marketing year. If this continues there is a good chance of out pacing last year that had inspections top 500,000 only 9 times all of last year. Export sales were 825,000 tons. The last time sales hit that level was this time last year. Although, the US Dollar continues to rise putting pressure on US Wheat exports sales. The strength in the US Dollar is perhaps a contribution factor in the Black Sea region surpassing the US becoming the world’s top grain exporter with Ukraine as the main contributor.
September 2016 Corn Charts
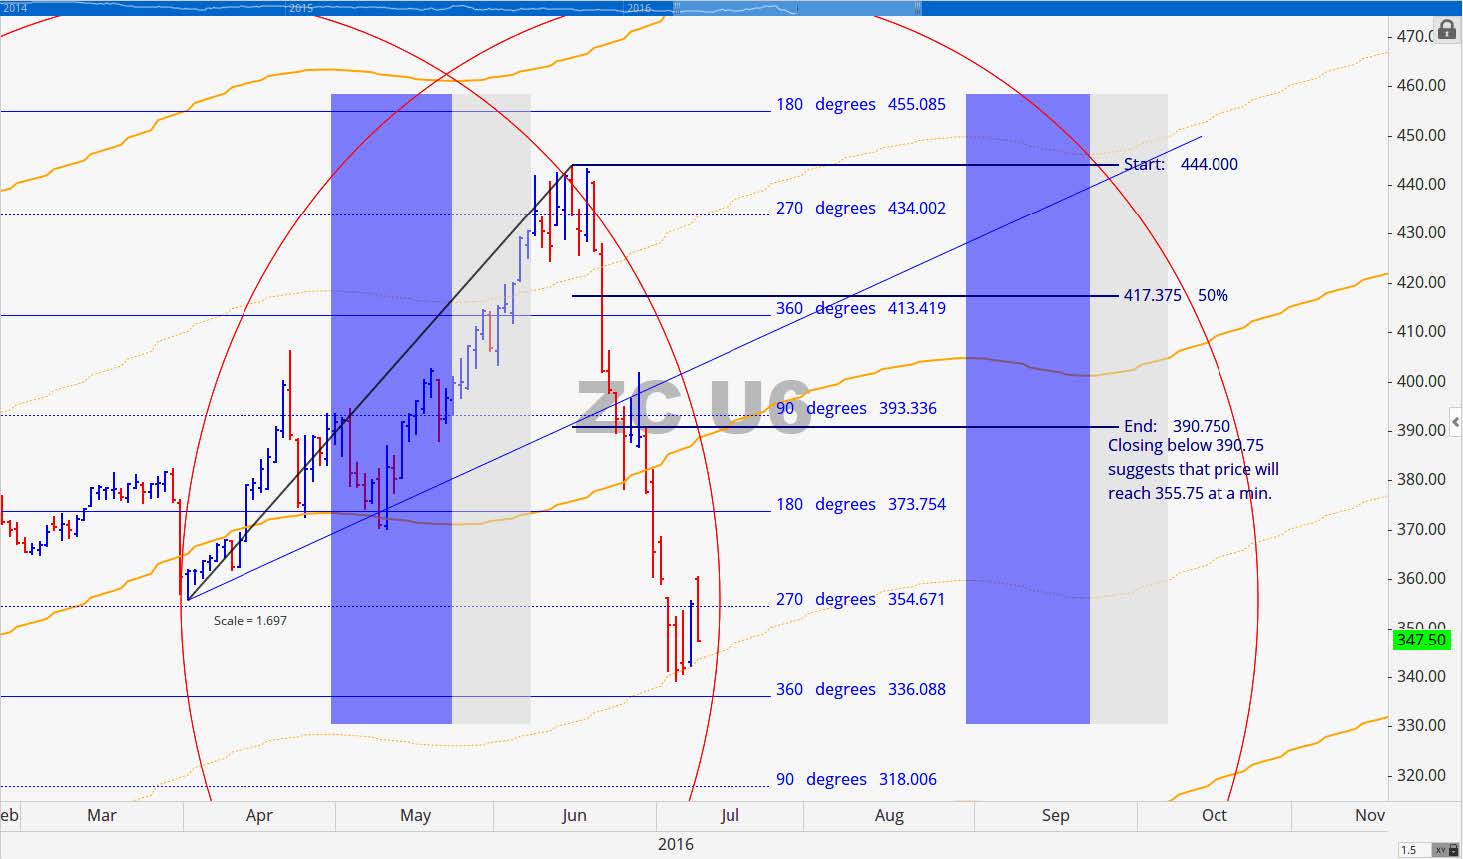
September Corn signaled off a major top at 444 which was right in between the 180 degree and 270 degree natural levels. From there it formed a continuation pattern near 393.50 which was about 180 degrees from the 444 high. As you can see annotated on the chart we were looking for price to move down to 355.75 at a minimum because of the close that was made below 390.75. From there it made a two day pullback in concert with the USDA quarterly report and prices continued to plummet from there. Potential support now lives near 336 but a close below 336 could cause another major leg down. Right now we think that near term support at 336 could hold up for a few days at least. You will notice on the chart that lows over the past 5 trading days have all been right against the natural orange trend line.
From our cycle perspective prices reached our downside objective a bit early (about two weeks early). Corn could thereby move sideways into our next cycle time line which is August 2nd. We had long suggested that Corn would top mid-June then move down into the end of the month. Retracement rallies of 38% to 50% are potential levels to sell into.
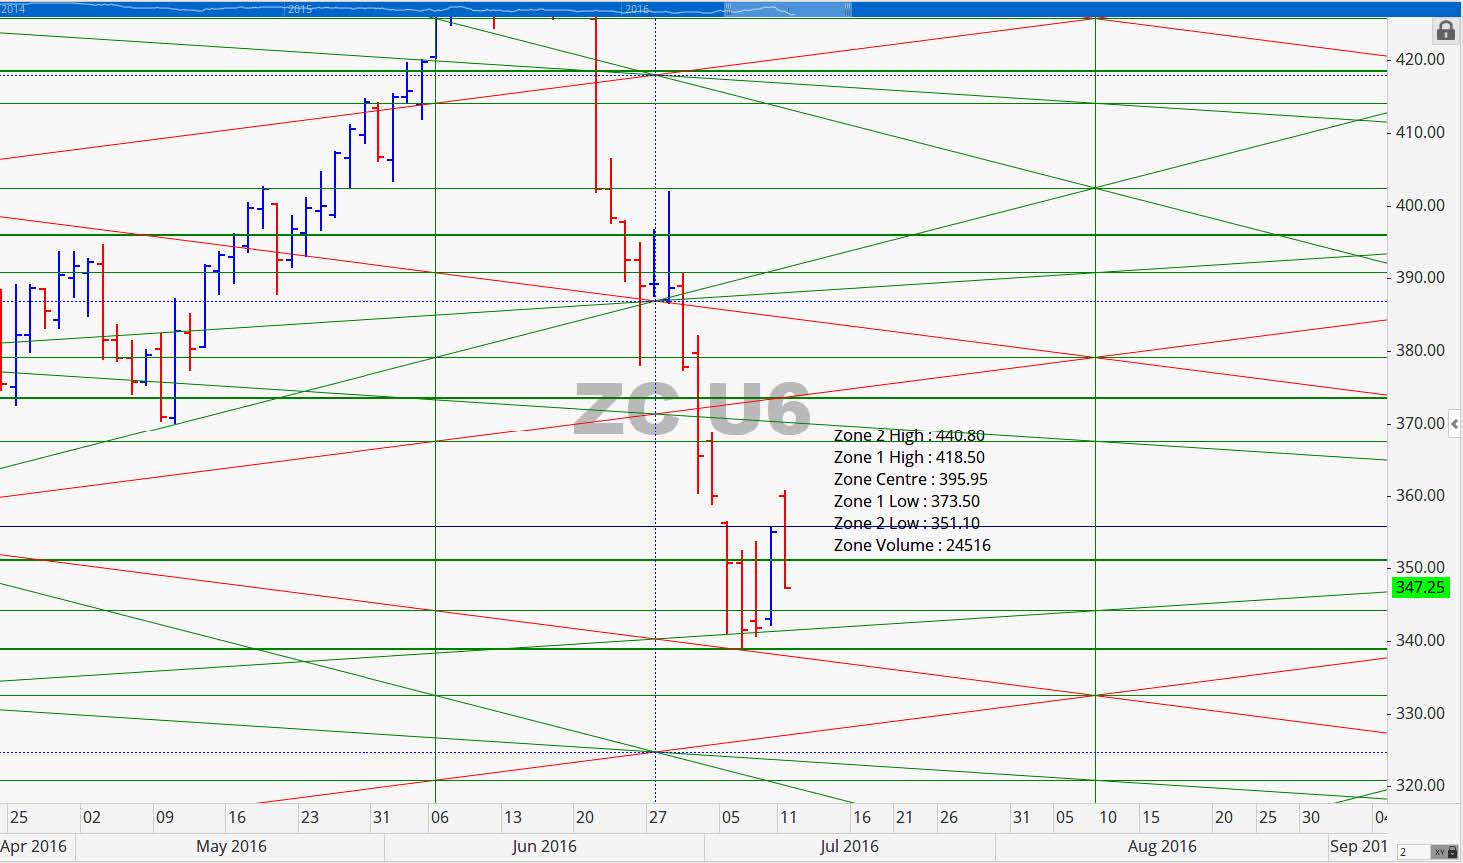
The point of control level for this contract was 396. As you can see in the chart below, once it gained strength through 396 it move down through the next two levels with ease. If it is able to close above 351 this week there is hope that a retracement to 373.50 is possible at which point we would anticipate some resistance there. Above 374 the next key resistance would be in the range of 394 to 396.
December 2016 Corn Charts
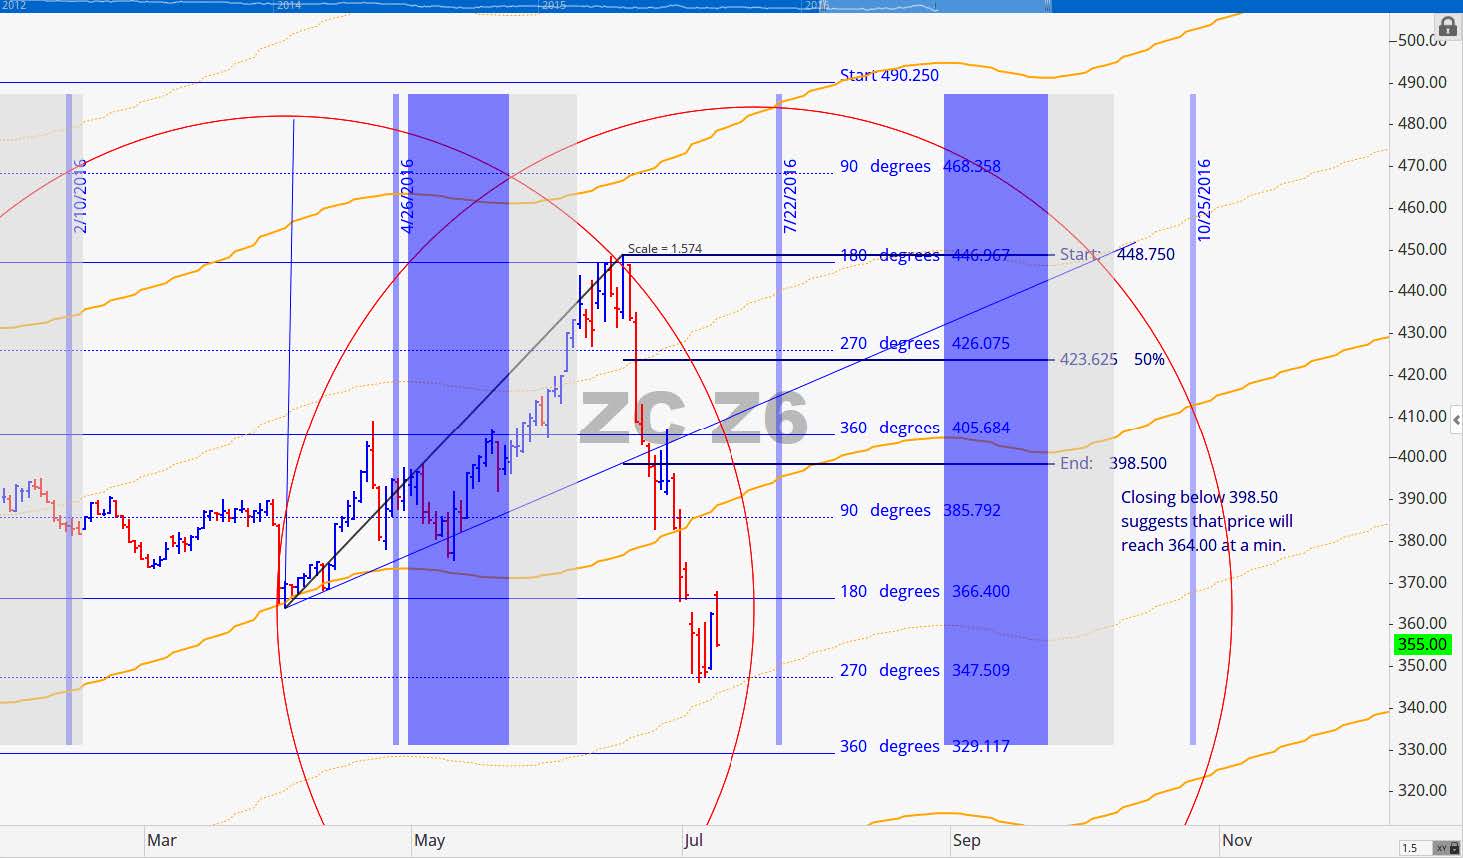
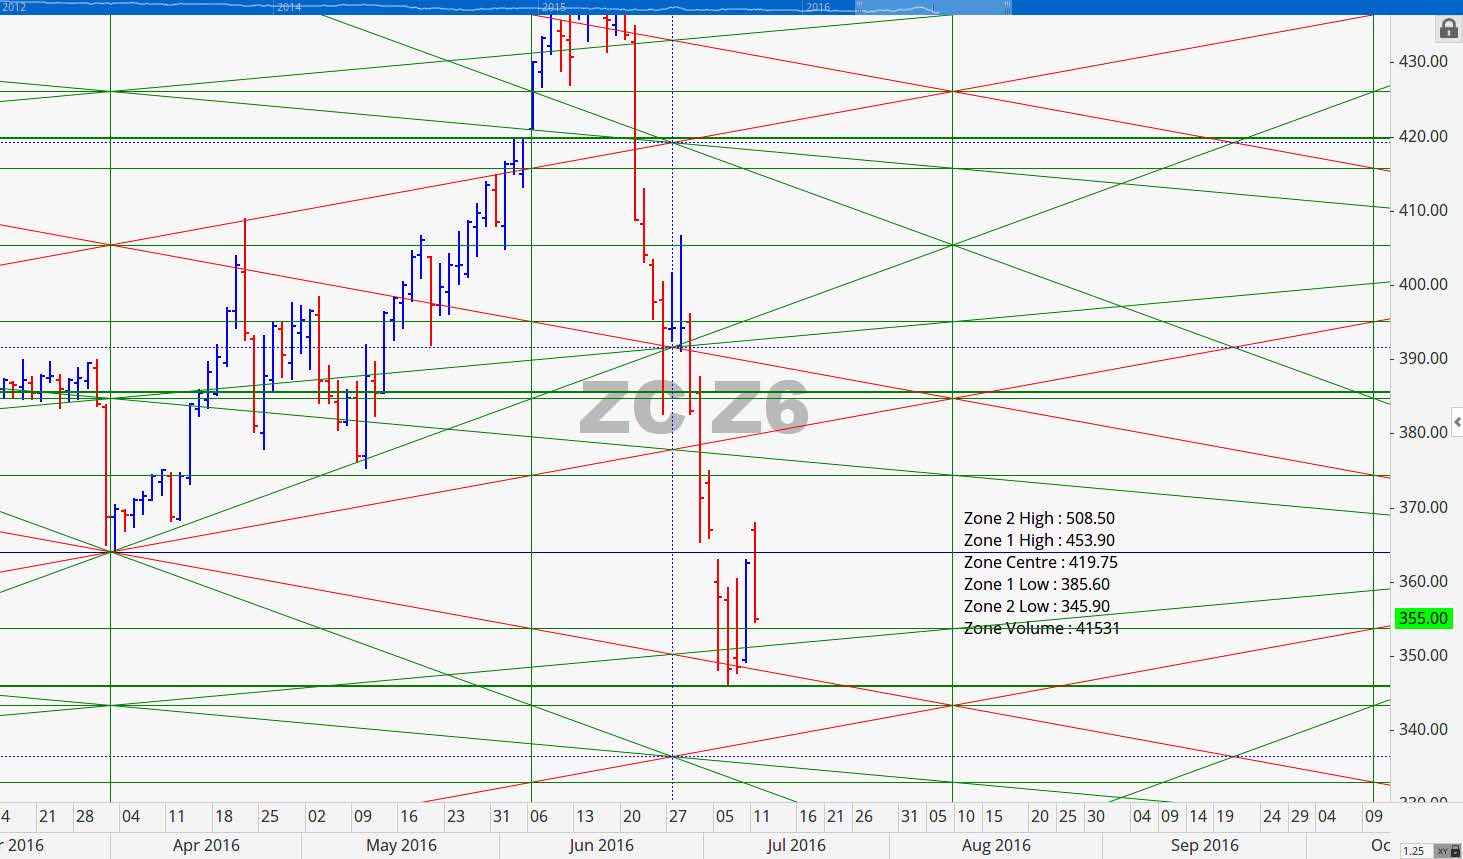
The December Corn contract found its top at 448.75. It’s decent was text book. Notice how it moved down from the 180 degree mark to the next 180 degree mark (one full cycle down). From there it gapped down over that 180 degree mark at 366.50 then made a low 90 degrees below the gap level. It filled the gapped today by gapping back up to the 366.50 mark when it opened overnight on Sunday. Like the September contract it moved up into or end of month time line only to collapse post the USDA announcement. The next important date on the horizon for this contract is July 22nd.
September 2016 Soybean Charts
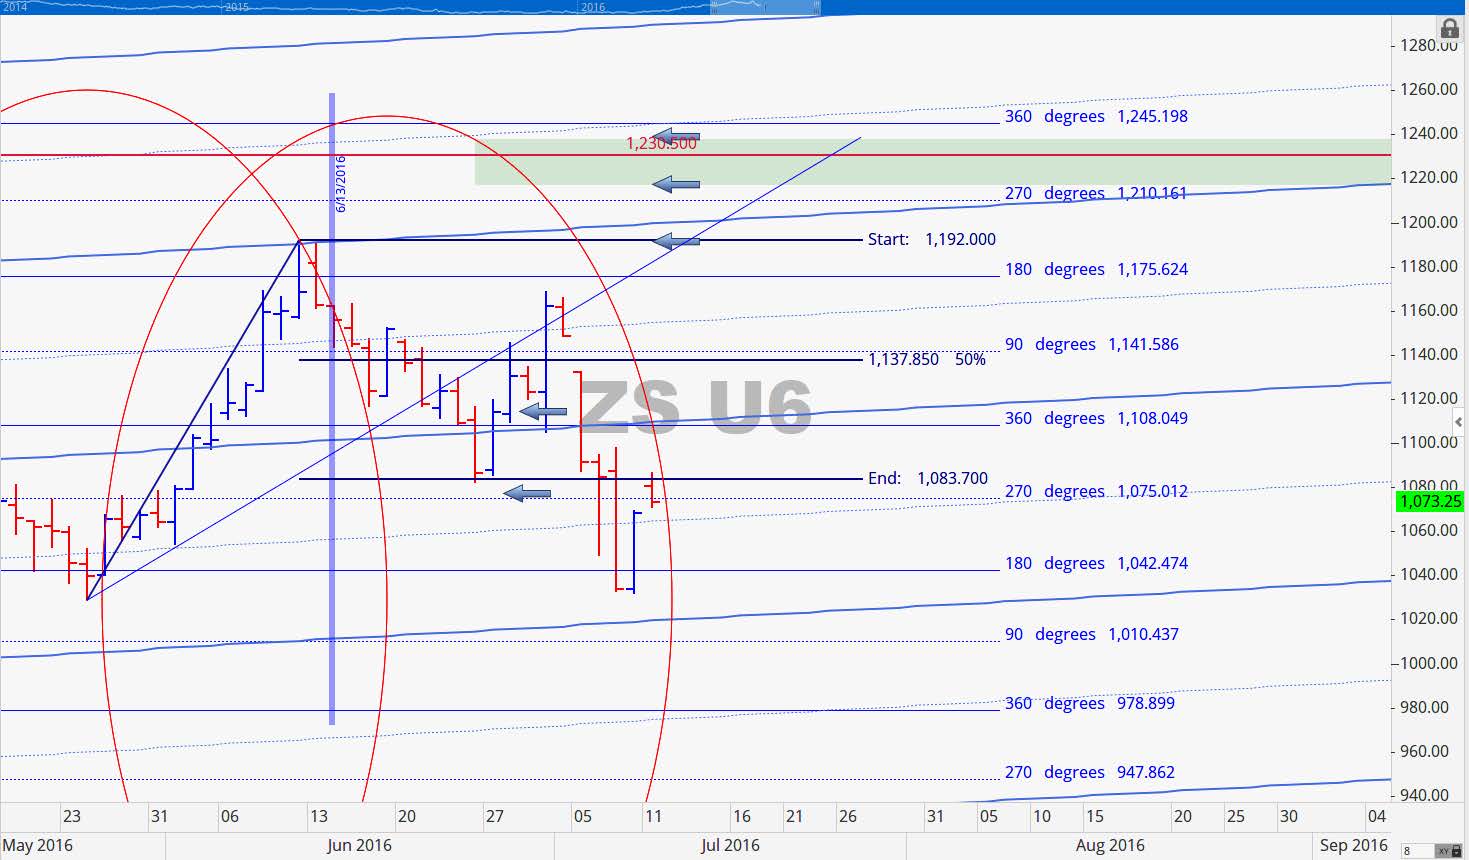
When September Beans reached our 1083.75 mark we thought there was a chance that it would retest the prior high of 1192 or higher posting a significant top. It did move up from that level but it instead made a lower high and then proceeded to decline from there. Market cycles still indicate that prices could move sideways the rest of the month but the overall big picture suggests that prices should eventually start to decline all the way into late September.
Ideally we would have liked to see prices close above 1138 with 1-2 days after making the low near 1083. Instead it did not close above that level until 4 days later. Price has moved one full cycle down from the 1175.75 high. Some key levels to watch now are 1010.50 below and 1108 & 1141.75 above.
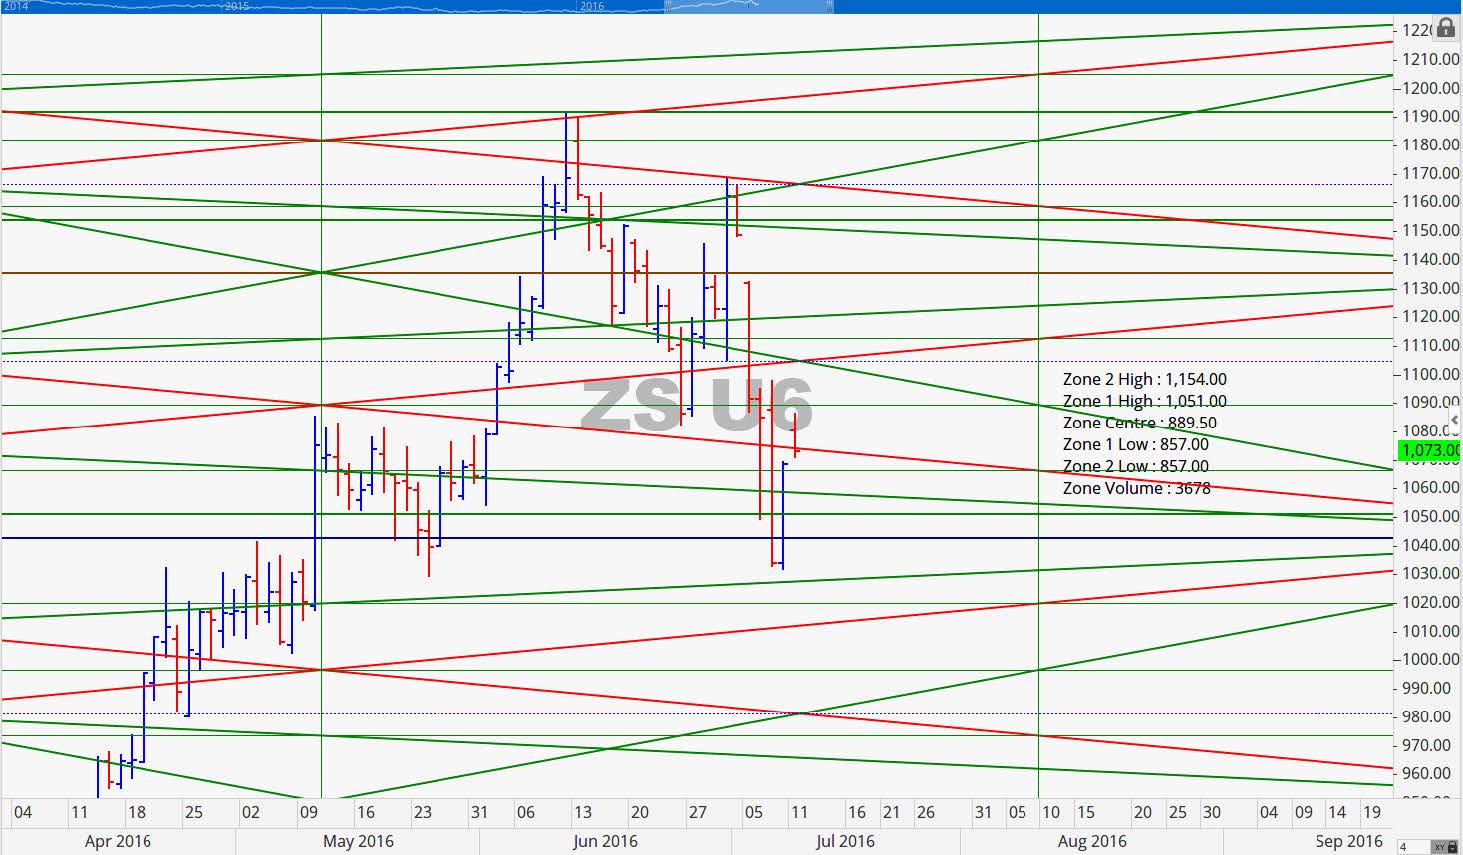
Two standard deviations above the point of control is 1154 which was just below the June 30th high of the day. The contract posted one close below the next level of 1051 and quickly moved back above it. This week the price level of 1051 will be in focus. Above it we could see some strength and below we anticipated potential continued weakness. As we move into August and September we would not be surprised to see prices reach 857. Our minimum price objective for this contract is 889.50.
November 2016 Soybean Charts
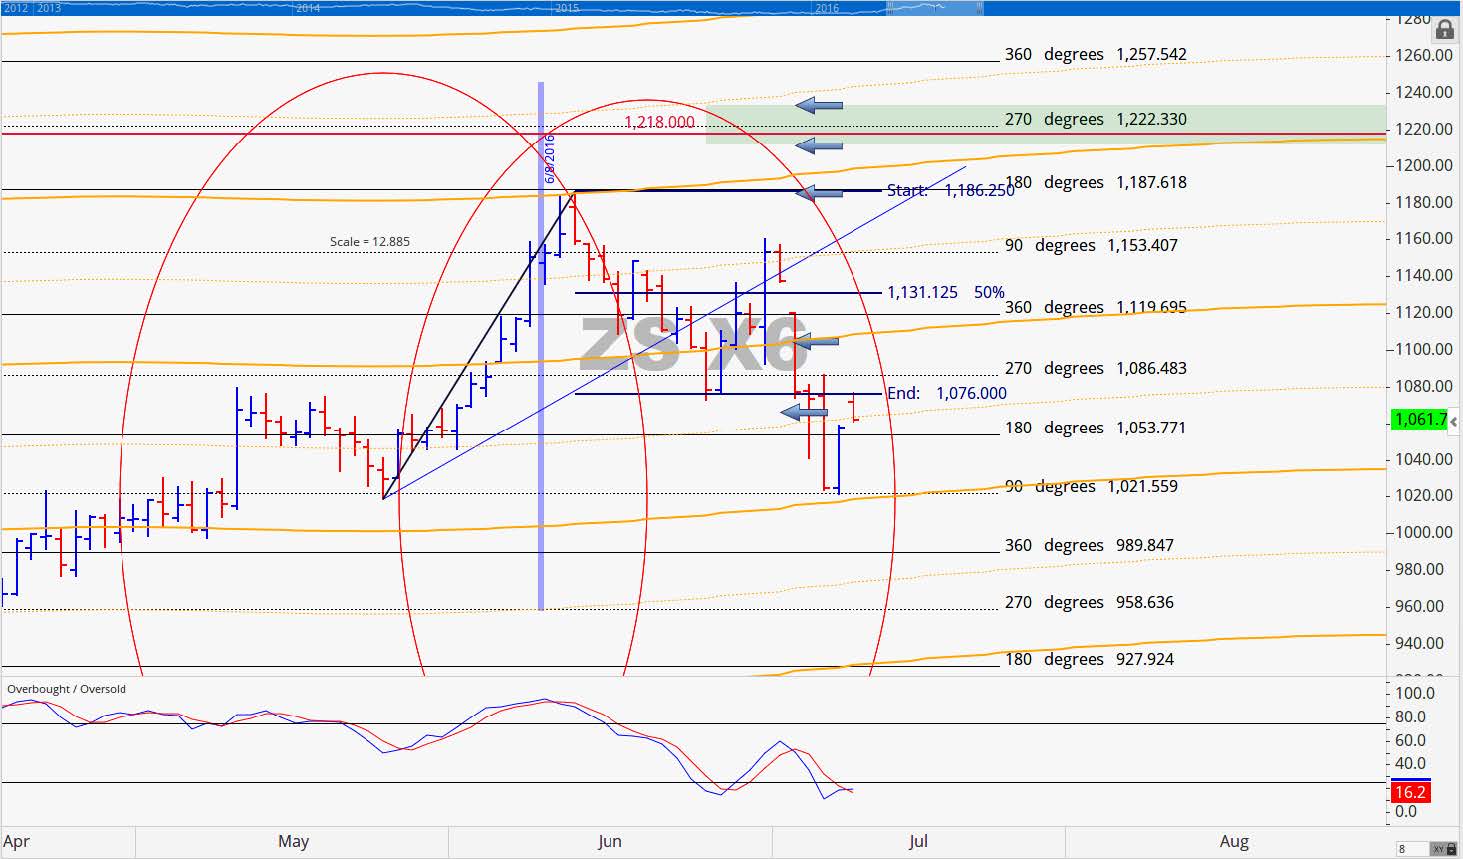
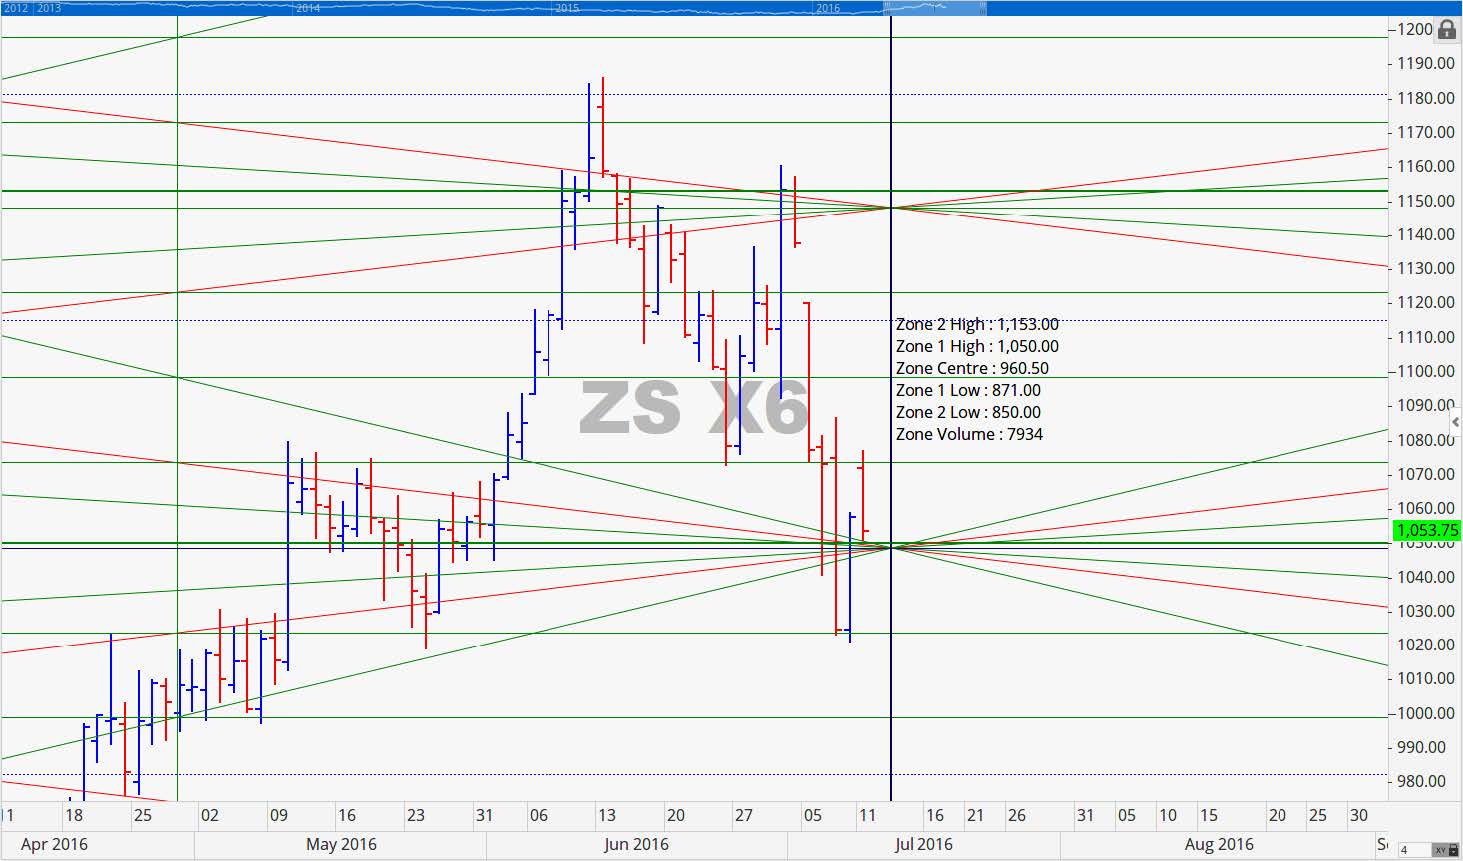
The price action on the contract is similar to that of the September contract. Support at 1076 was spot on followed by a price advance that lasted 5 trading days. Upon reaching the 90 degree level of 1153.50 resistance held followed by a full cycle decline of 360 degrees down to 1021.50. It is probable that the price could reach 990 this week so we suggest caution in trying to call bottoms.
Grain Market Overview October 11
Read more