

Commodity Market News Dec 29
December 29, 2015Grain Market Overview Jan 6
January 6, 2016Commodity Market News Jan 5

Summary
U.S. stocks posted steep losses on their first trading day of 2016. The Dow Jones Industrial Average plummeted 276 points (-1.58 percent) to end the session. Investors grew skittish when China's Shanghai Composite Index fell 7 percent over weaker-than-expected manufacturing data and a falling currency. Trading in China had to be halted earlier leaving Chinese stocks at their lowest level in three months.
The news did not end there for the start of the New Year. Tension between Saudi Arabia and Iran immerged after Saudi Arabia executed Shiite cleric Sheikh Nimr al-Nimr on terror charges on Saturday. In the wake of the execution, Iranian protestors stormed the Saudi Embassy. In the wake of the violent attacks on the Saudi Arabian embassy in Tehran, Saudi Arabia has severed diplomatic ties to Iran and Saudi allies are following suite. The developments had made for a bumpy ride in the Crude Oil prices over the course of trading today.
Corn
The Corn market continues to be in a weak fundamental position and on this first day of trading for the New Year it dropped right into our minimum price objective levels. The March contract ended the week down 5.75 (-1.58%) at 358.75 and the December contract was off 6 cents (1.54%) at 383. Current cycle are pointing toward continued lower prices through the middle to late February. There are weather reports of beneficial rains in the Corn producing regions of Brazil this past week. The impact of the rain remains to be seen. During this time of the year the Brazilian Corn crop should be filling the kernels with water making rain very important for Brazil this month. As I suggested last week, we are looking for a possible small rally leading into the WASDE report followed by a decline to about February 20th.
Soybeans
The next major events in the Soybean market are the January Quarterly Grain Stocks report, the Crop Production report and WASDE report scheduled for release on January 12, 2016 at noon Eastern. Last week March Soybeans finished the week down 8.75 (-1%) making a final print of 864.25 to close out 2015. November Beans lost 7.25 (-0.81%) ending the year at 882.75. Both contracts tested their respective December 17th lows. Our market cycles continue to point toward Beans moving sideways moving into the January 8-12 timeline followed by an advance that pauses near the January 22-25 time horizon. Remaining above the November lows between now and the 12th would bode well regarding higher prices. Also, the potential for increase input cost for Argentina stands to make for reduced acreage which could mitigate the supply that is projected to enter the market.
The USDA report raised Soybean yields to 48.3 bushels per acre versus 47.2 bushels per acre last month. Like Corn it came in at the high end of expectations at 3.981 billion bushels putting pressure on the prices after the announcement. The crop size is now approaching 4 billion bushels, a level that has never been reached before. The carry out grew to 465 million bushels. Export sales are running ahead of pace. The soybean harvest was listed as 95% complete last Monday and is now basically complete.
Wheat
July Wheat managed to close last week marginally on positive territory up ½ cent at 483.25. Unfortunately it returned to form today losing 9.75 cents. The December contract also lost 9.75 on the day. Over the weekend the weather turn beneficial in both Russia and the Ukraine as they received almost 4 inches of snow and the flooding waters in the Midwest finally started to recede. Wheat exports were down sharply coming in at 348 tmt. The July and December contracts are solidly in oversold territory but may not find solid footing for some time. For the July contract the next level of support is around 445 to 450 and for the December contract we are looking at 480.
Crude Oil
As mentioned last week the February Crude Oil contract made a low on December 21st of 35.35 then moved up. The low that was made on the 21st has continued to hold and we have a potential higher low that was made on December 31st. Current cycles are pointing toward a price advance through the end of this week. If prices advance and subsequently make another low at or near the December 31st low mid-February we would be looking for a move to the upside that goes into the middle of March. Last week The February Crude Contract lost 1.06 (-2.78%).
March 2016 Corn
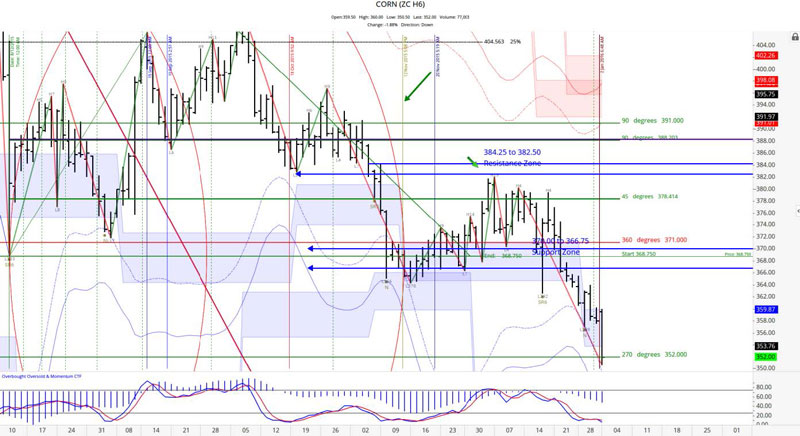
In the 1st chart below, we had a cycle date of January 2nd for the March Corn Contract. The 2nd land on the weekend so the next trading would be a viable candidate for anticipated energy in the market action. Today did not disappoint as March Corn suffered its largest point loss in about 2 weeks. Last week we suggested that an initial downside objective of 359 to 352 was at hand. Today’s low of 350.50 satisfied that price objective.
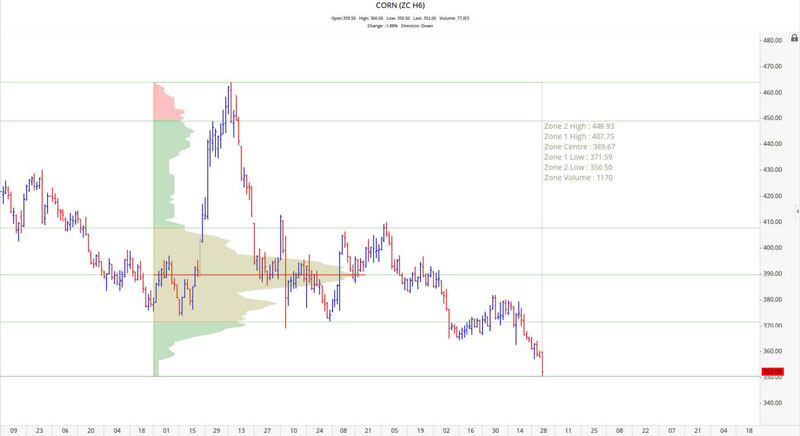
In the chart that follows we want to introduce the notion of a point of control based off the volume at each price level analyzed over a recent swing. The price level of 389.75 is the current point of control for the March Corn contract. For a while the 1st zone on either side of the point of control proved to be strong support and resistance. Upon breaking the lower zone sellers appear to have lowered their offering prices sending prices lower. At this time 371.50 will be the 1st level that this market needs to regain before we can turn our bias from being bearish.
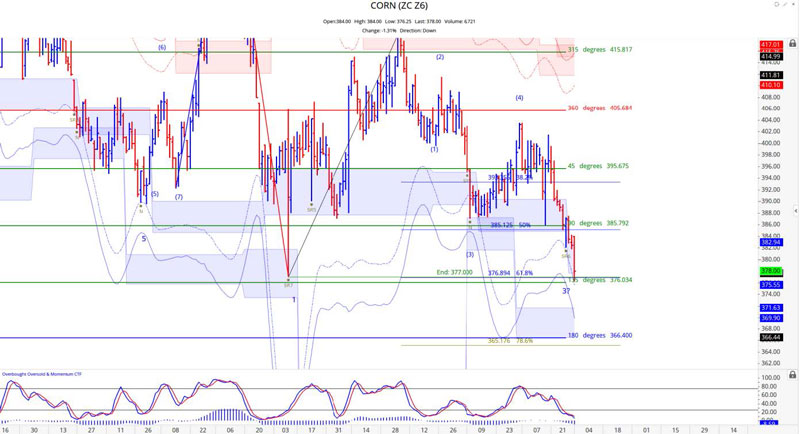
December 2016 Corn
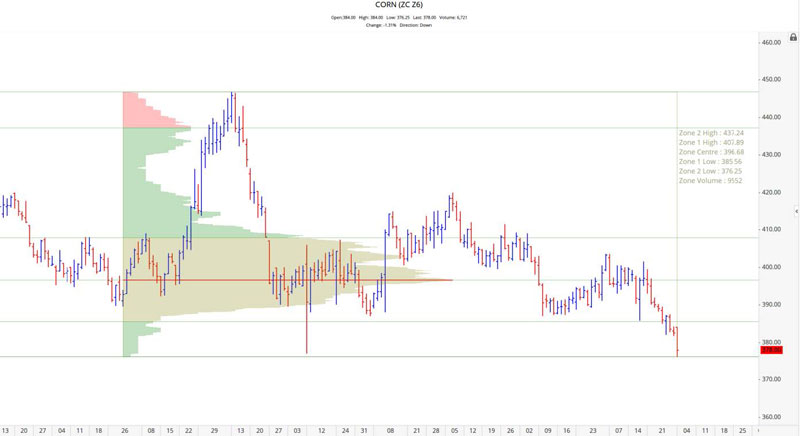
December Corn also reached our minimum price objective making a low of 376.25 today. It closed at the bottom range of volatility based support retesting the August low of 377. A close below 377 could send price to the 365 to 366.50 range so we would caution traders not to try and bottom pick here. The point of control for this contract is 396.75. The volume though the price range of 375 to 385 is fairly thin which lends itself to large spike moves at these price levels. We suggest caution at these price levels..
March 2016 Soybean
The current make or break level for March Beans contract is 849 and the point of control is 888. Below the ‘make or break’ point it could trade down to the 818 to 825 price range before finding strong support. In the chart below we have superimposed two scaled Geometric tools. The bottom of the smaller circle coincides with the 849 level. If the price is able to pause there and then advance prices have a reasonable chance of tracing the upward sloping angle that starts at the 849 price point.
November 2016 Soybean
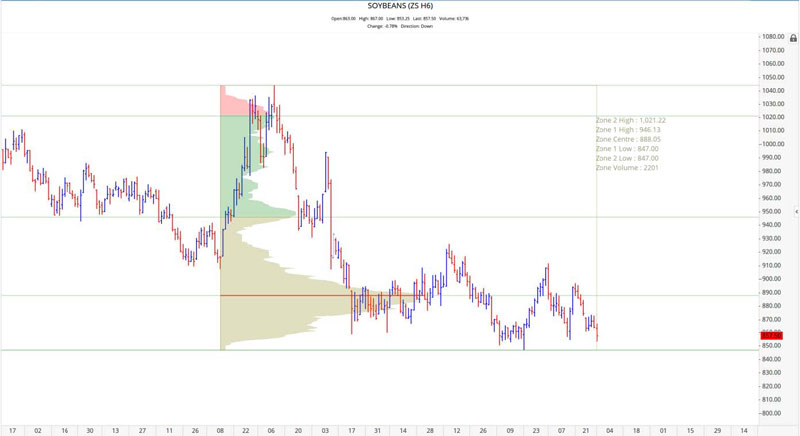
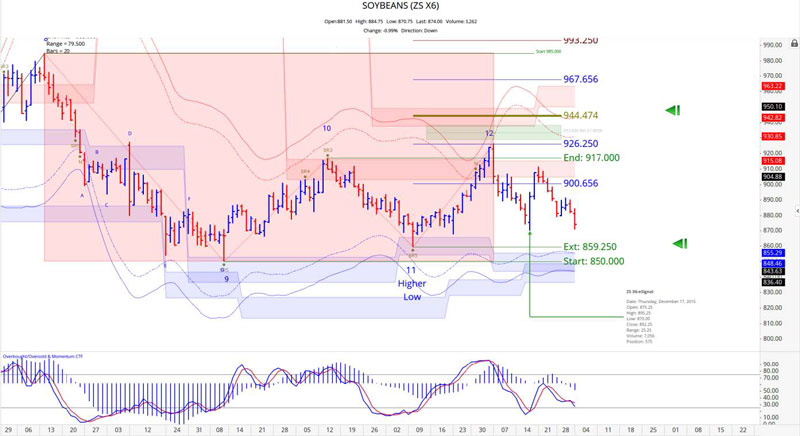
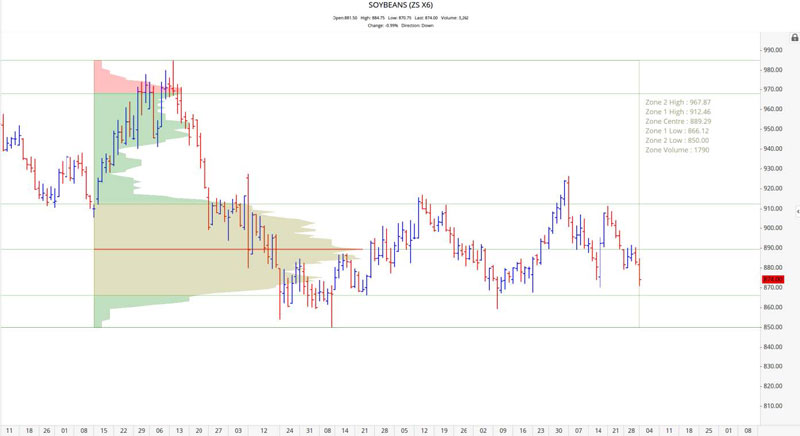
November Beans is still holding the 870 level but barely. Today it made a low of 870.75 before closing at 872.75. The price levels of 870 and 859.25 continue to be very important potential support levels for this contract. Price is currently in the middle of volatility based support and resistance. The movement on the chart suggest that the price might get to 859.25 for support. The Stochastic is almost in oversold territory so it makes sense that price would move down a bit more. The point of control for this contract is 889.25. Above 912.50 we anticipate that prices will move up very fast. Out of the money calls near the strike price of 912.50 are optimal when time appropriately.
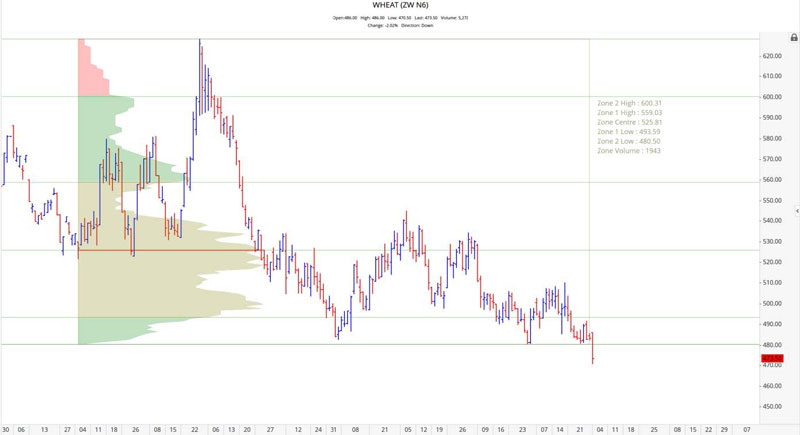
July 2016 Wheat
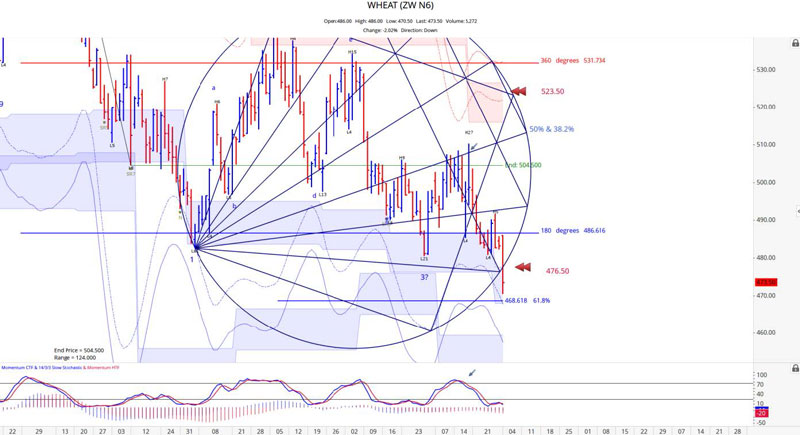
The July Wheat held up last week but broke out of our Geometric Circle today to the downside. Price met and exceed the 476.50 last suggested and looks to be headed to the anticipated 465 price threshold. The current point of control is 525.75 and it has exceeded two key price zones from that point of control.
The US Dollar Index was in positive territory today and it is likely going to make a run to 100 in the not distant future. The Russian and Ukraine crops appear to be in solid footing so it is not looking good for US Wheat market.
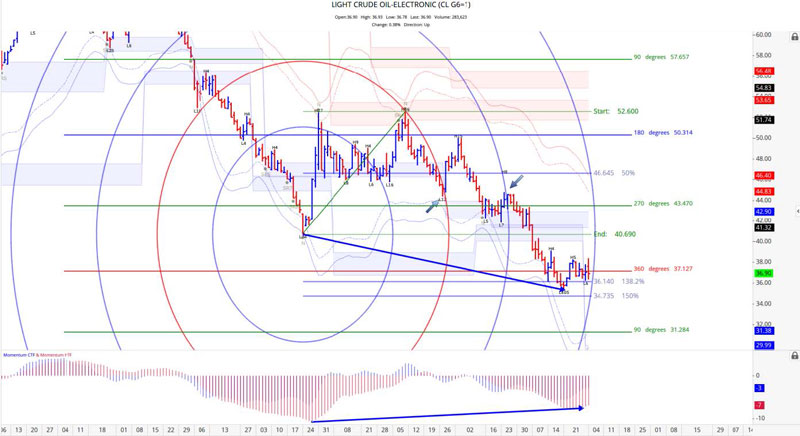
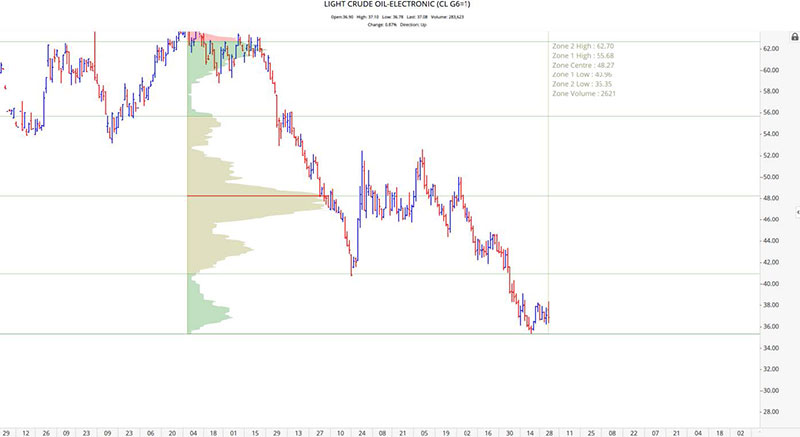
February 2016 Crude Oil
February Crude Oil has been vibrating well with our harmonic circles. The last two times it intersected a harmonic circle the price action reacted. We are now a few days away from the next intersect point and we are anticipating a potential pivot could be in play. In the chart below we have strong divergence. Also, the recent headlines regarding Iran and Saudi Arabia did not cause a sustained move up. It may be that we see a delayed reaction that shakes out those who went long immediately. The point of control for this contract is 48.27 but 40.96 is very close to the 40.69 level that we shared with you last week and anticipate that prices will find strength upon getting to 40.96. Again, a higher double bottom with prices above 40.69 would certainly peak our interest with regards to possible longs.
Grain Market Overview October 11
Read more