
Grain Market Overview 2/24
February 24, 2016We Welcome David Freund
March 1, 2016Commodity Market News Feb 29

Summary
In the news, a Senate Agriculture Committee markup of the federal bill addressing Genetically Modified Organisms (GMO)/Genetically Engineered (GE) food labeling was postponed last week and is now scheduled for Tuesday, March 1st. It appears that the central goal of this bill is to preempt a mandatory GMO labeling law scheduled to take effect July 1 in Vermont. Last July, the House passed HR 1599. It creates a provision for food and beverage makers to comply with a national standard for genetically modified food labeling while averting state laws.
The market focused on the Ag Outlook Forum last week. It ran from February 25-26 (Thursday & Friday) in Arlington, Virginia. This annual conference has typically served as the starting point for initial discussions concerning the new-crop US Corn and Soybean Supply and Demand tables. Of particular interest is the USDA’s spring planted acreage projections. It is from here that producers and end users begin to truly formulate their ideas as to where the harvest futures contracts may perform.
USDA Chief Economist, Robert Johansson, presented early Thursday morning revealing some of his insight on crop specific acreage allocations and pricing forecasts for 2016. US planted Corn acreage was estimated at 90 million acres versus 88 million in 2015 which was very much in line with the average trade estimates of 89.6 million. US planted Soybean acreage was estimated at 82.5 million acres versus 82.7 million in 2015. It was also in line with average trade estimates which were at 83.3 million. These projects are very much in concert with current market sentiment suggesting that the grain markets will continue to be under pressure for the coming months. The best case scenario for prices to rise would be some kind of weather related event.
Corn
The USDA Ag Outlook Forum estimated the Corn crop will be 13.825 Billion Bushels (BB), which would be the third largest Corn crop on record. The Corn ending stocks were forecasted at 1.977 Billion Bushels (BB), the highest in a decade. Then if you add the Brazilian harvest to the mix you are looking at an additional 81.5 million tons of Corn. March Corn fell 11 cents (3.01%) on the week and first notice is today. December Corn lost 8 ½ cents (2.20%). Our cycles indicate that Corn may make a low in early March followed by a small advance but looks to make a subsequent lower low in last May.
March 2016 Corn Charts
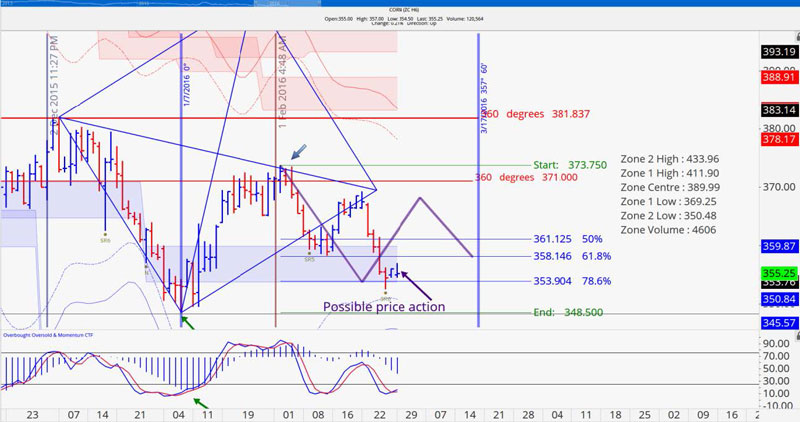
Our price action projection for the March Corn futures correlated nicely with the actual price action. First notice is today and this contract might find it difficult getting much lower than 348½ on its way to coming off the board. Going forward out attention will be on the May and December contracts.
December 2016 Corn Charts
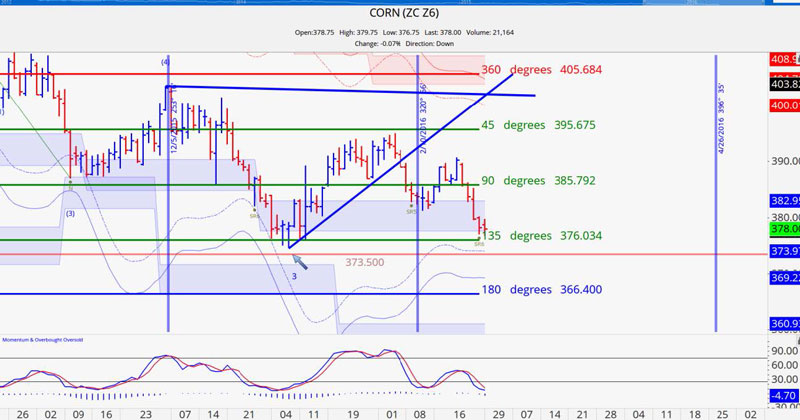
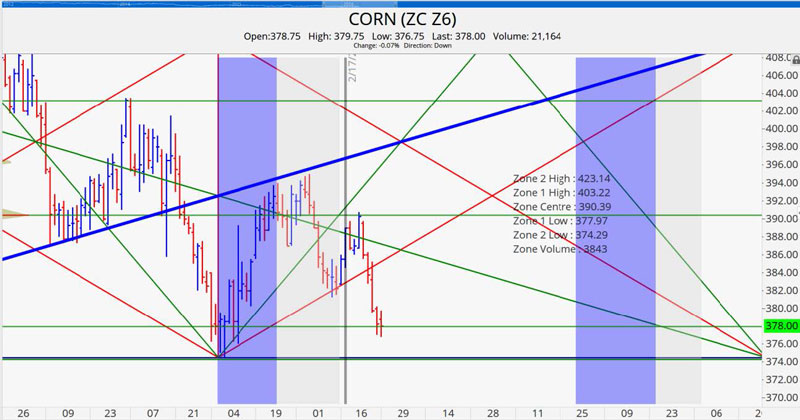
The December Corn contract topped on February 22nd and is approaching an N-Band of volatility based support. Prices are currently testing the January 7th low of 374 ½ and it appears that somewhere in the neighborhood of 370 is a reasonable spot for a near term bounce. The high that was high last week was at the point of control mark, the way in which it responded to that level is an indication that there are several sellers still camped at that level and they were willing to lower their offering pricing in order to get filled. Once some of that selling subsides we can see a potential bounce.
Soybeans
The 2016 Ag Outlook Forum last week released quite the bearish outlook. The USDA expectation for Soybean was the third largest ever production at 3.810 Billion Bushels (BB) but with lowed ending stocks to 440 Million Bushels (MB) because of strong export numbers. Soybean futures will find it difficult to hold up prices especially on the heels of Brazil’s back to back record harvests. Last year Brazil harvested a record 96.2 million tons of Soybean and is expected to outdo last year with an expectation of harvesting 100 million tons. The Brazilian harvest should be complete by the end of March.
March 2016 Soybean Charts
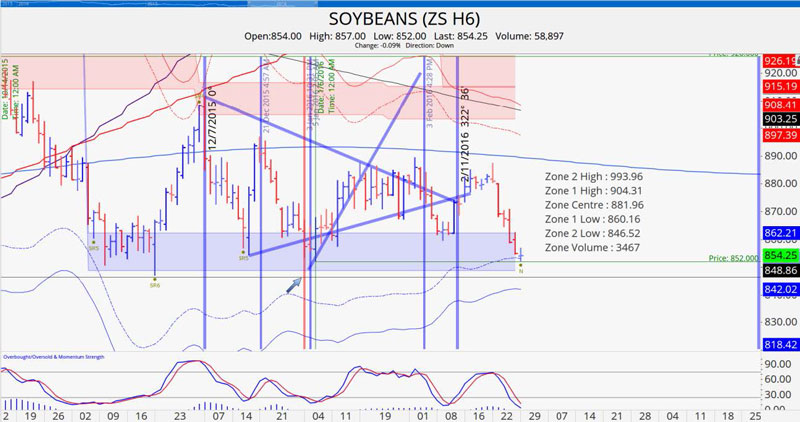
There is a reasonable possibility that March Beans comes off the board without breaking below 840. It is down 5 trading days from its high. It is sitting at volatility based support and is oversold. Now that 1st notice has occurred the contract of focus will be the November contract.
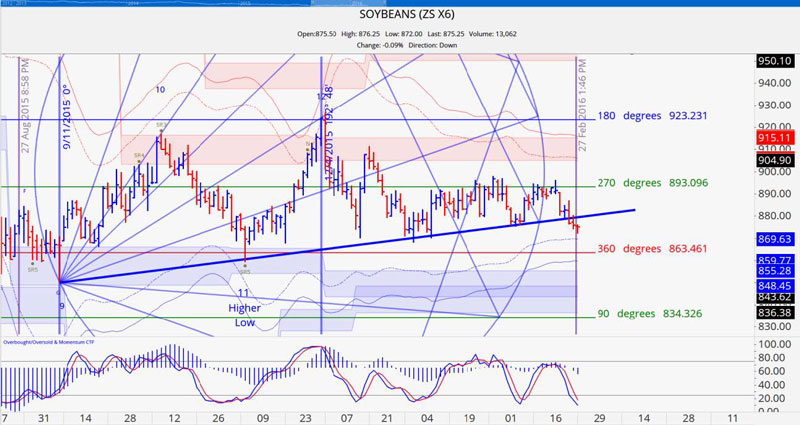
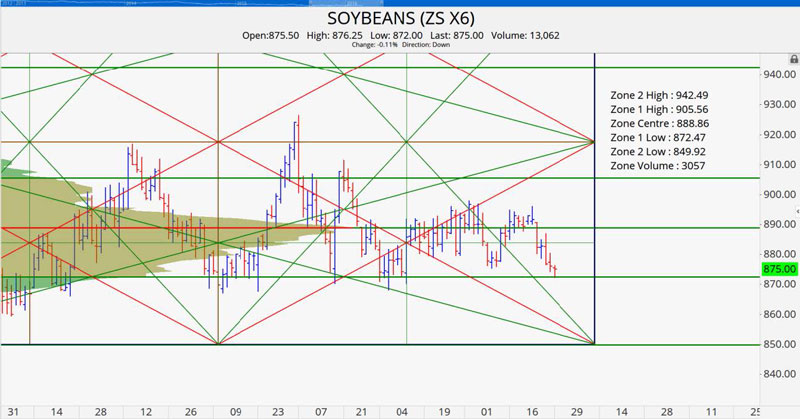
November 2016 Soybean Charts
As anticipated November Beans broke support on this most recent test of support. It moved up to resistance at 893. Upon breaking below the 889 point of control it proceeded to move lower. We currently have support at 869 ½ then at 863 ½. Since it is in overbought territory we believe either of these levels is an opportunity for a short term advance.
Wheat
The USDA said that the Wheat carryout could increase by 23 million bushels above its current estimate for the 2015 crop, putting ending stocks at 989 million bushels. The stocks to use ratio is still very high 47.3%.
Egypt said that they have enough Wheat in strategic reserves to last until June but we would not be surprised to see them still continue to offer tenders if prices keep dropping. Exports for February were projected to be a record for the month.
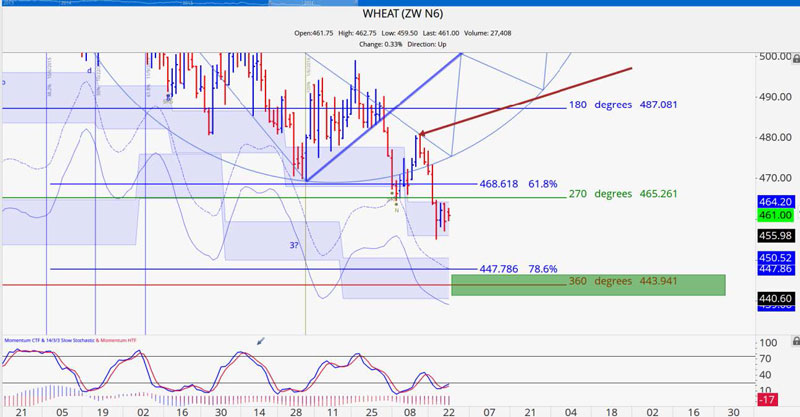
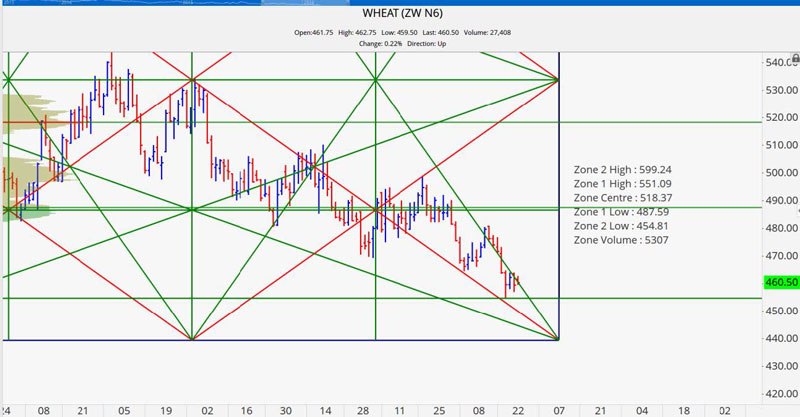
July 2016 Wheat Charts
The July Wheat contract is in the midst of a four day consolidation and is poised to break lower reaching the 444 level at a minimum. It continues to trace out a pattern of weakness and until it starts making higher lows prices are doom to be down to sideways at best.
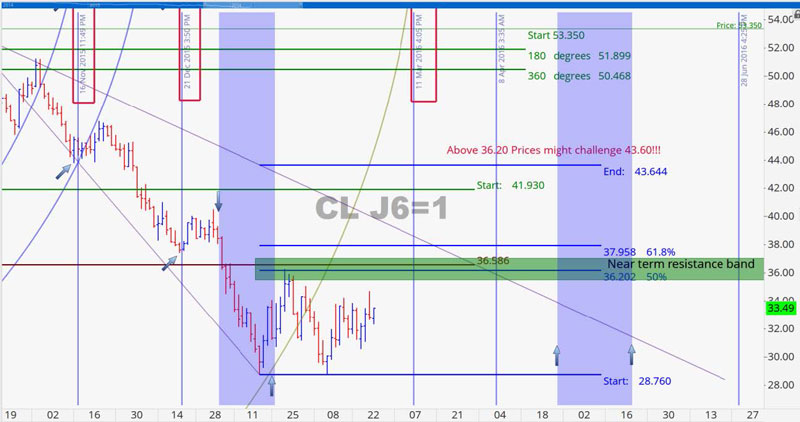
Crude Oil
April Crude was up $1.03 (3.24%) last week. Even with no real OPEC deal in place, the technicals are prevailing and Crude has now been consolidating since making a significant low on January 20th. Our current level of opportunity is resting at 36.30. If this contact is able to post a few closes above that mark we believe there is a strong possibility that prices would move to 43.60 short thereafter. Currently we have strong resistance in the area of 36.20. We also have a date of significance on March 11th for a potential price pivot. Be on the lookout for a possible trend change indication near that timeline.
Grain Market Overview October 11
Read more