
Grain Market Overview July 27
July 27, 2016Grain Market Overview August 3
August 3, 2016Commodity Market News August 2

Summary
Over the last four trading days Soybean futures have oscillated between a positive and negative close on each of those days. One day the trade responds to beneficial rains then on the next day somehow export sales is able to reverse the general sentiment only for the weather to again cause a change of direction on the next day. As of this weekend the National Weather service is calling for rainy August weather. Previously we shared that there is a reasonable probability that Beans would be weaker through the month of August and possibly through the month of September as well. For now we are starting off the month in that direction. The day to day swings are often tools or windows of opportunity for funds or managed money to systematically liquidate their positions. If a fund was looking to liquidate a sizeable portion of its portfolio it would not all in one day unload everything. Instead it would make use of the daily ebbs and flows of the market action. In doing so they will strategically offer limit orders at key resistance levels. When funds are able to effectively disguise their intentions producers often get trapped thinking and hoping that prices will recover. It is in those moments of hope that producers watch prices move from levels that may have been profitable to prices that are not so favorable.
Last month commodities posted their worst July performance on record. For many producers they face the dubious challenge of figuring out when to price, at what levels to price and how much of the crop to price in any given month. The discipline of setting up and sticking with a marketing plan is where success is found. Our newsletter is only a subset of the mix. Some of the objectives of the newsletter is to offer actionable support and resistance levels as well as to highlight potential cyclical and scientifically derived turning points. Our team is dedicated to your continued success. We encourage you to contact us and make use of our Marketing and Risk Management services.
The final tally for July was brutal. November Beans lost 150.25 cents or 13.03%, December Corn lost 28.50 cent or 7.68% and September Wheat lost 37.75 or 8.47%. The lost posted by Beans includes a strong move on Friday that was ignited by a big export sale report and a sizable drop in the US Dollar. The Greenback has been strong for quite some time and was due for a correction. Last week we shared that 97.62 was the next key level for the US currency. The high reached last week was 97.569. Knowing these levels in advance of the price action can often make a world of a difference. Support for the US Dollar Index is at 95.51 and then at 94.45.
According to a high level agricultural official China intends on cut back on their planted Corn acreage by 9 percent over the next four years. China is battling oversupply and this move only scratches the surface of the supply issue. The US is also staring down the potential for record supply. If demand is not able to rise to meet the glut of supply then prices could remain down to sideways for quite some time. China halted its stockpiling protocol this year and Beijing is pushing producers to grow alternative crops.
Monsanto made its way into the news last week. On Friday last week Reuters reported on the discovery of GMO Wheat that was developed by Monsanto in a Washington state farm. The problem is that the strain that was found has never been approved by the Federal Regulators according to the USDA. The USDA is testing grain harvested from the farmer's other wheat fields as a precaution. Officials have reached out and alerted importers.
Corn
September Corn ended the week down ½ of a cent and the December Corn was up 1 cent. It was a small ranging week for Corn futures as it remained inside of the bottom 1/3rd of the previous week’s trading range. The commitment of traders report showed that speculators were big sellers on the week but that did not really show up in the price action. The big story has been the number of contracts sold over the past month and a half. Speculative traders laid down the gauntlet selling 318k contracts of which 40k were sold last week. Corn is still in a weaker position but may not suffer the potential price decline that Soybeans could be in for. Looking ahead the trade might have already discounted Corn below fair value so be careful of price putting in a low this week and basing for the balancing of the month. Just because a potential low is in does not mean that price will rise. Instead prices could suffer a slow sideways death instead.
Soybeans
In spite of a rough month, Beans managed to at least finish the month with a positive gain on the week. September Beans gained 21.25 cents and November Beans added 14.75 cents on the week. There were four Soybean export sales reported last week and that went a long way in being able to help buoy prices last week. The biggest sales were on Thursday with 129k tons to China and 328k tons to unknown. Another 129k tons was reported on Friday. Weather forecasts may have played a role but by now it should be obvious that the trade is uncertain as to how to respond to the recent weather indications. These back and forth swings is par for the course. We warned that August historically brings some volatility to the Soybean price action and its opening August trading day did not disappoint.
Wheat
After taking a breather the previous week September Wheat returned to form and dislodged 17.50 cents last week. In the Black Sea region it is being reported that the Ukraine Wheat crop is growing larger. Estimates for them were raised from 23.3 million tons to 24.8 million tons. The rain and floods in France had their way with the French crop reducing yield estimates to their lowest in about 3 decades.
The Wheat tours in North and South Dakota are all wrapped up. The estimated yield came in at 45.5 bushels per acre, 4 bushel per acre behind last year’s estimates but in line with the 5 year estimate.
September 2016 Corn Charts
The gov. is reporting 95% of the corn crop to be in the Fair, Good or Excellent category. Wheat forecasts continue to be favorable which is pointing to a bumper crop in the fall. By the end of this week we are looking for Corn to bottom and potentially make a counter trend rally. If that occurs look for a small rally into the middle of the month followed by a down to sideways move for the balance of the month.
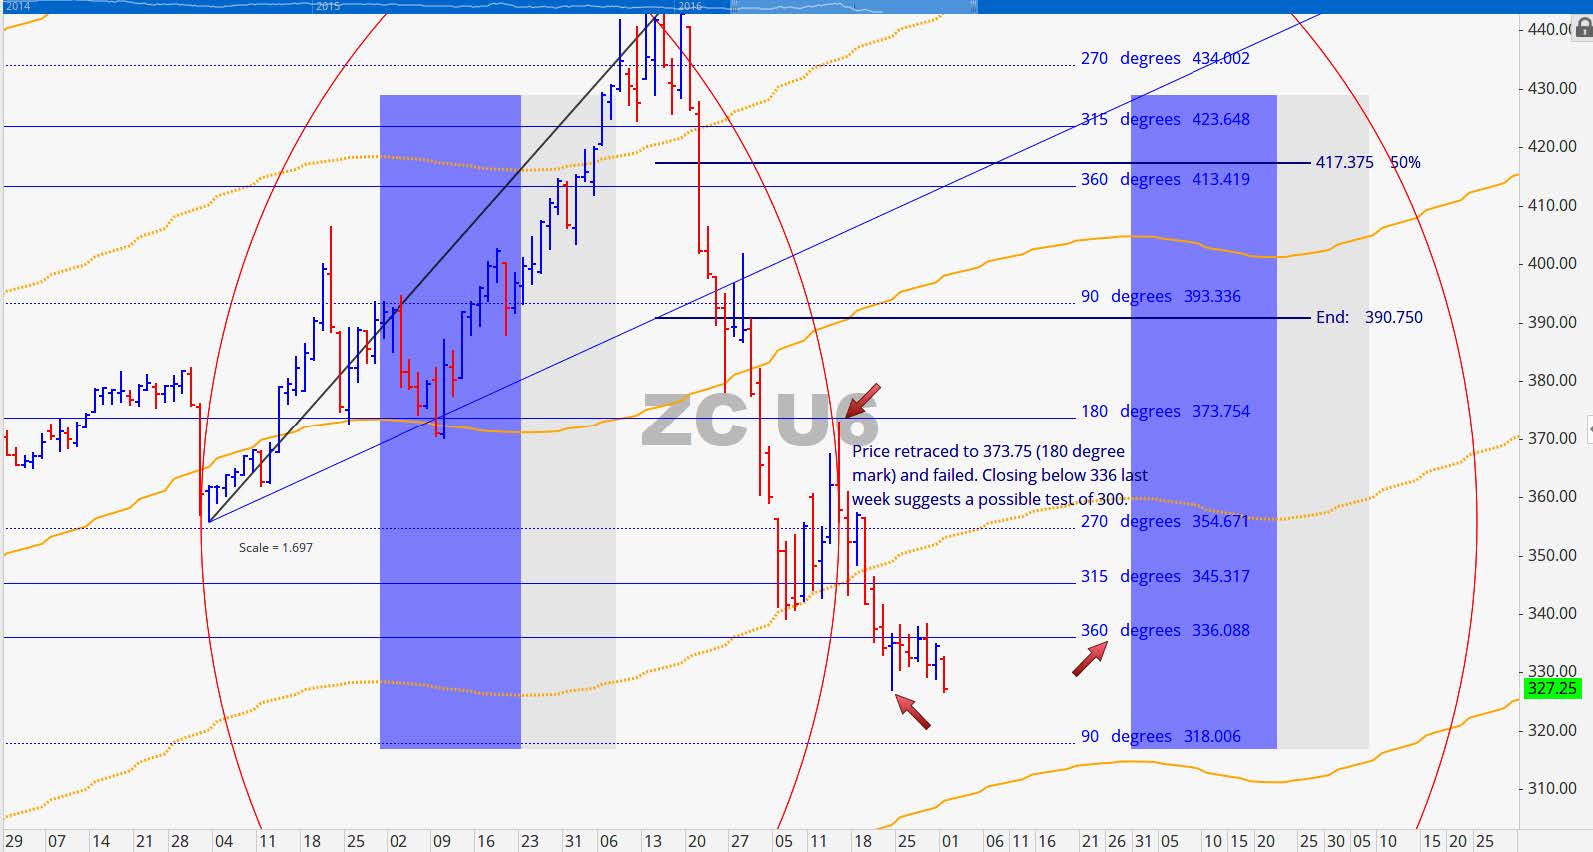
Last week we highlight a few key levels. First, 336 proved to be outstanding price resistance. With prices closing below 336 last week we are looking for the low to come in near 318 or 300 in the event that it breaks through 318.
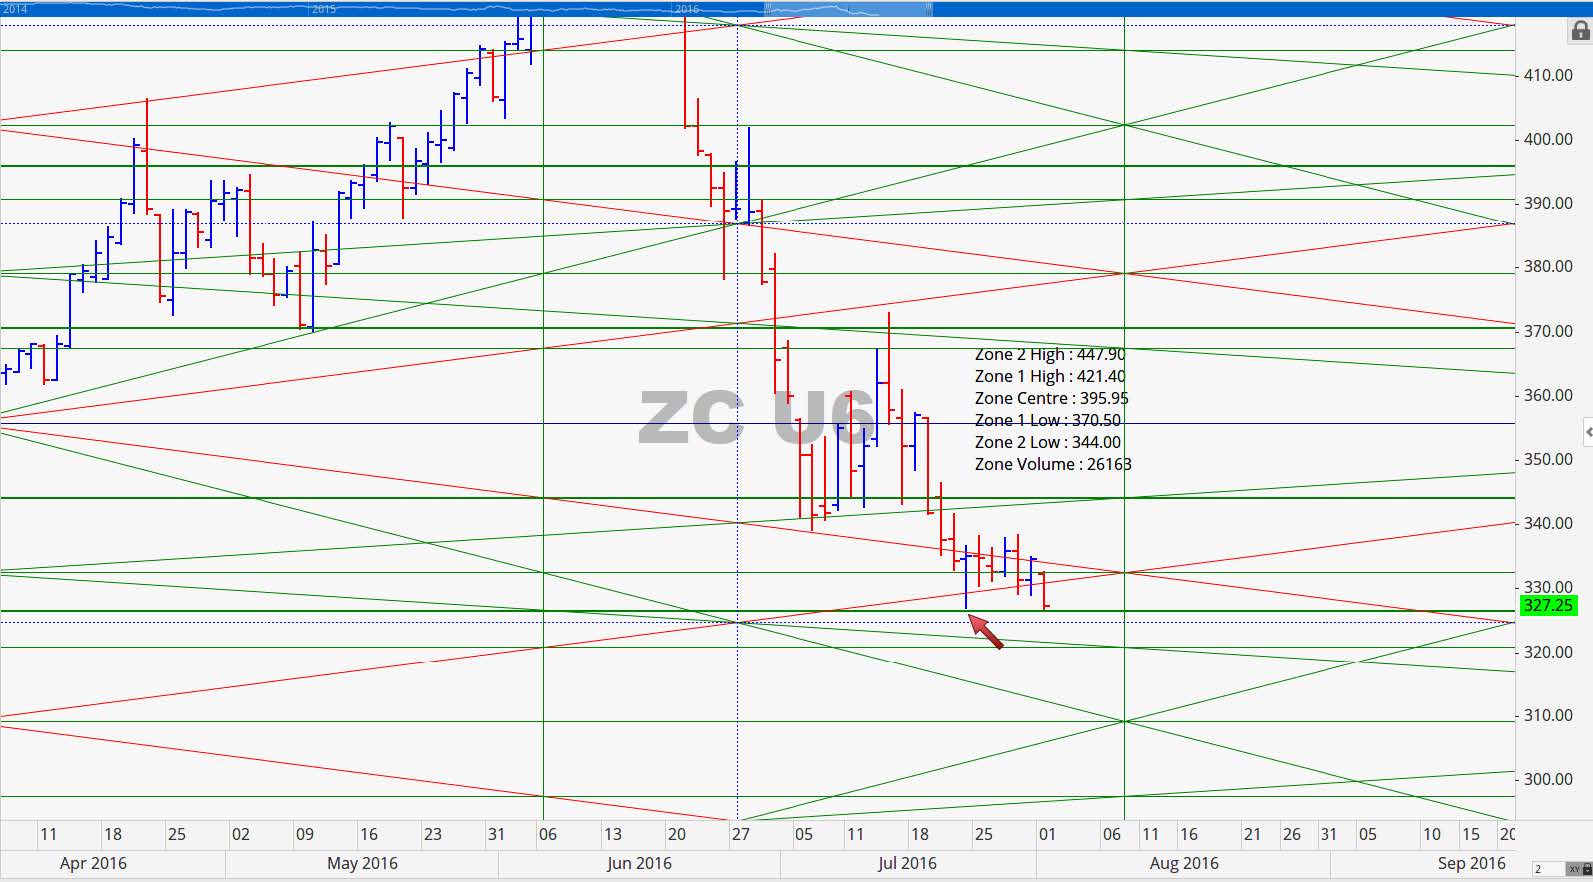
Two levels below the point of control is 344. This is key resistance for the week. The horizontal line below the current price action is at 325.50. After the August 2nd time factor we have August 9th -10th as a window for a small market reaction. It is marked off as a green vertical line on the chart below. One more thing to be on the lookout for is a spike in volume and this could be an indication of exhaustion.
December 2016 Corn Charts
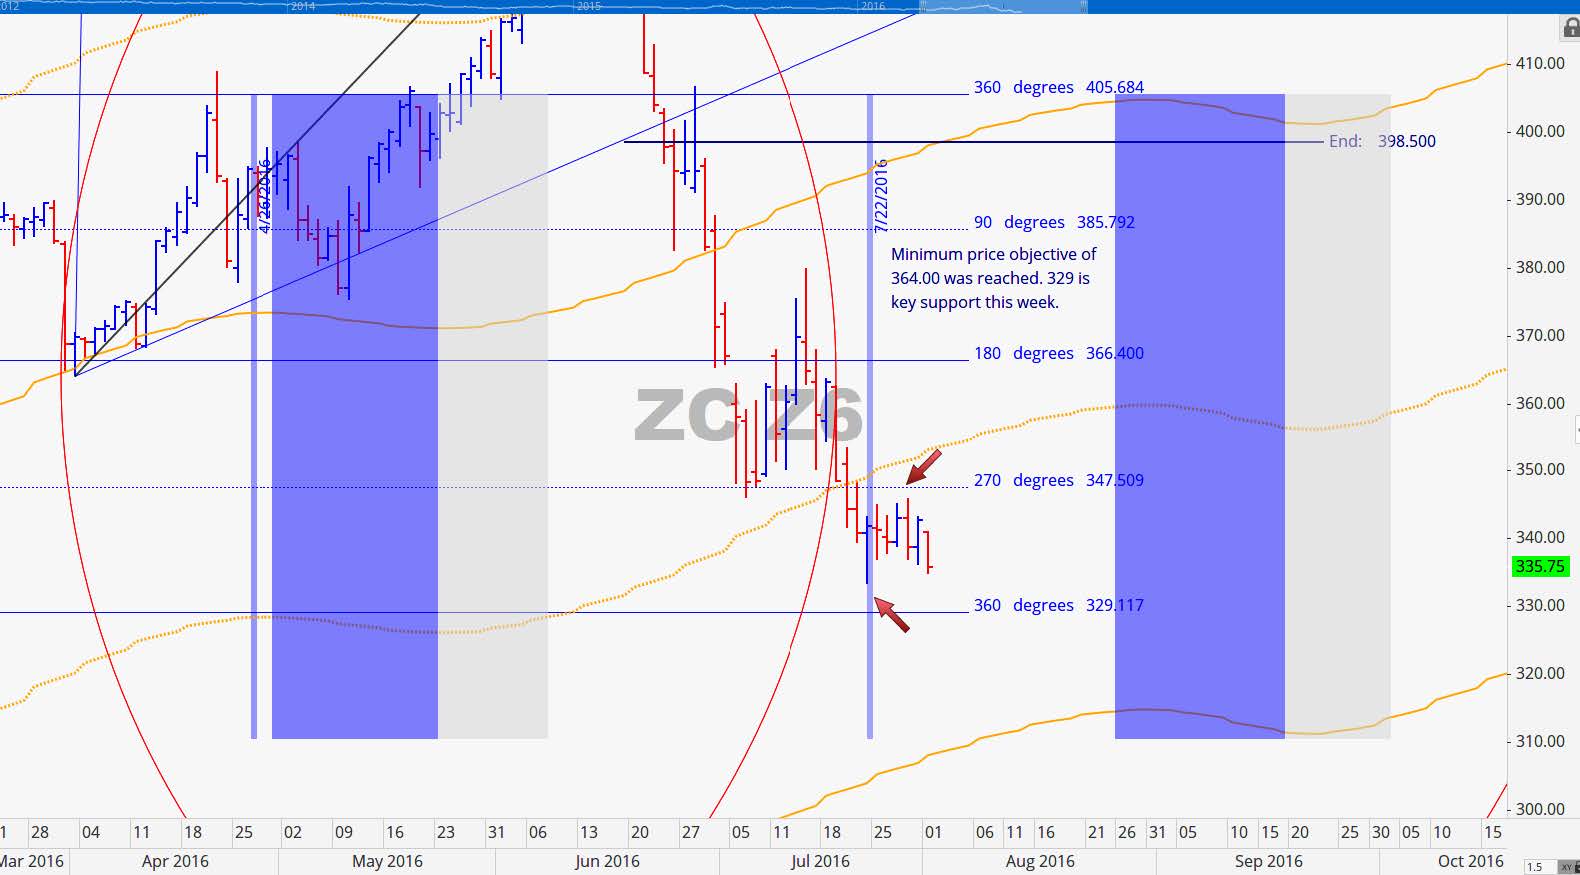
The July 22nd projected turn date worked out very well. It has been six trading days since it was hit and price still has not broken that low. Typically we are looking for price to reverse or pause for a minimum of 5-7 trading bars when turning point events occur. This week the downside level of importance for the December contract is 329 followed by 311.25. Overhead we are looking at 347.50. Movement is consistent with our expectations and simply waiting to see if a low is confirmed this week.
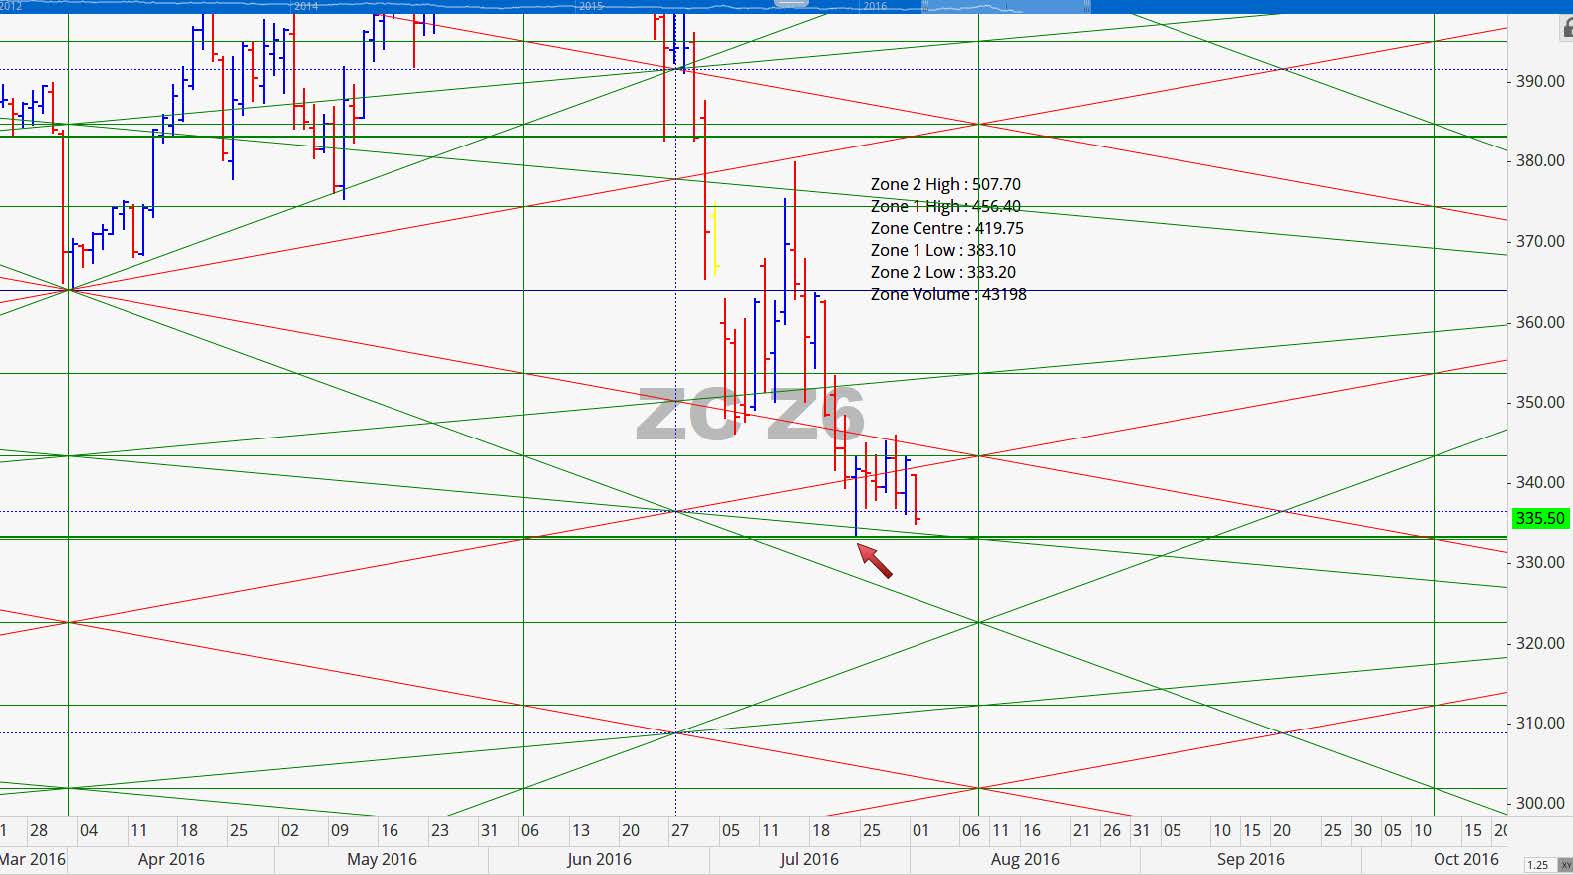
The December Corn contract tagged the level that is 2 standard deviations below the point of control at 333.25. That low occurred on July 22nd. When price and time comes together in this fashion the probability of a change in direction increases. Today we are retesting the low from the 22nd of last month and it looks like it will possibly be broken tomorrow or in the overnight session.
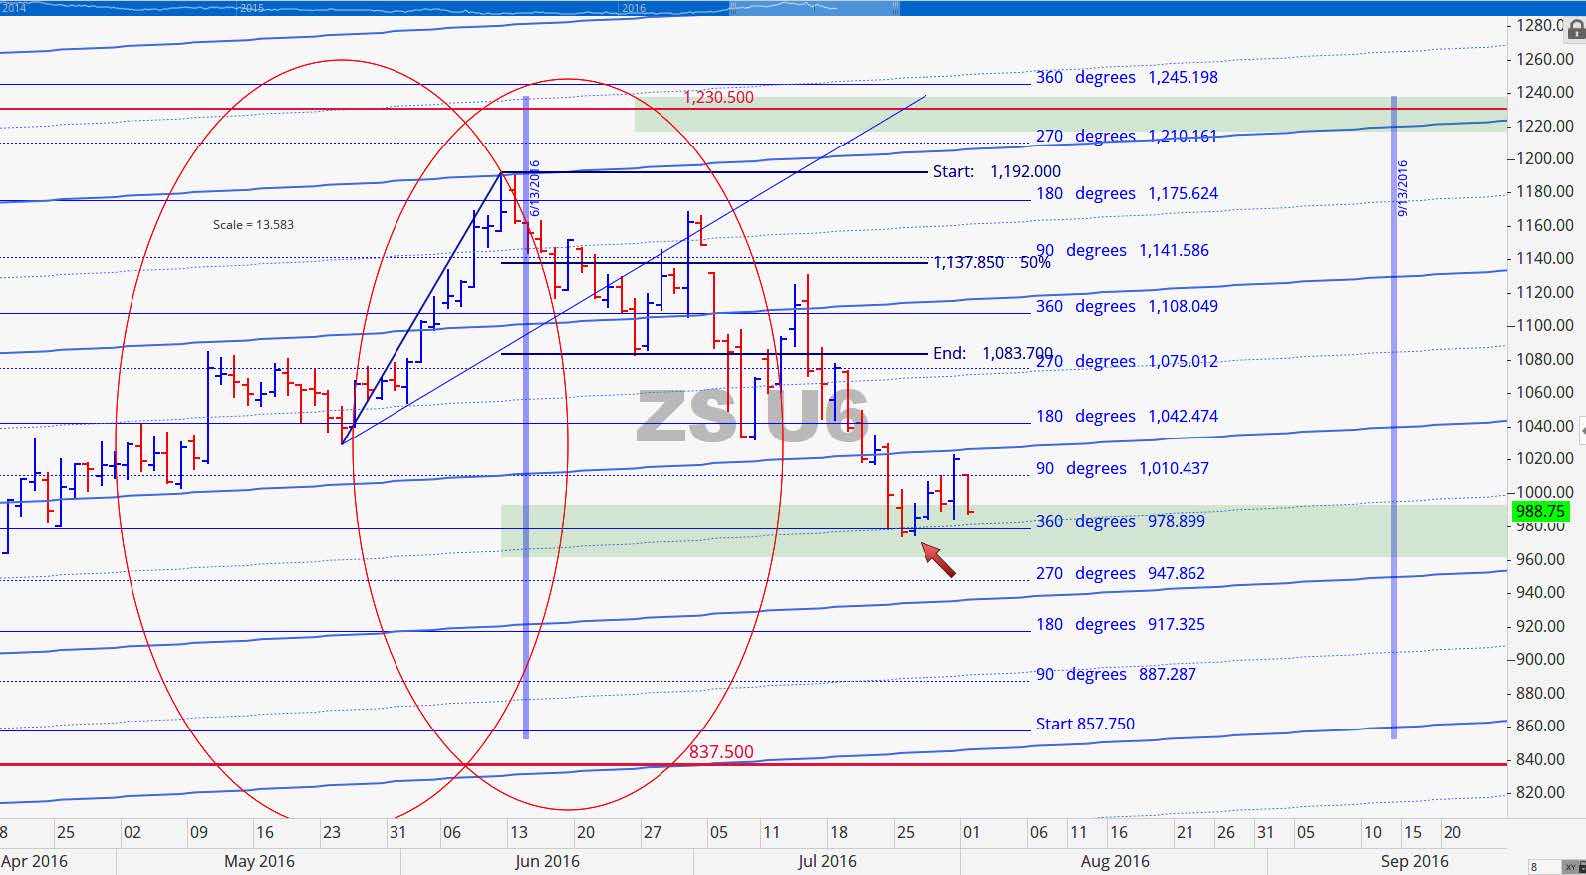
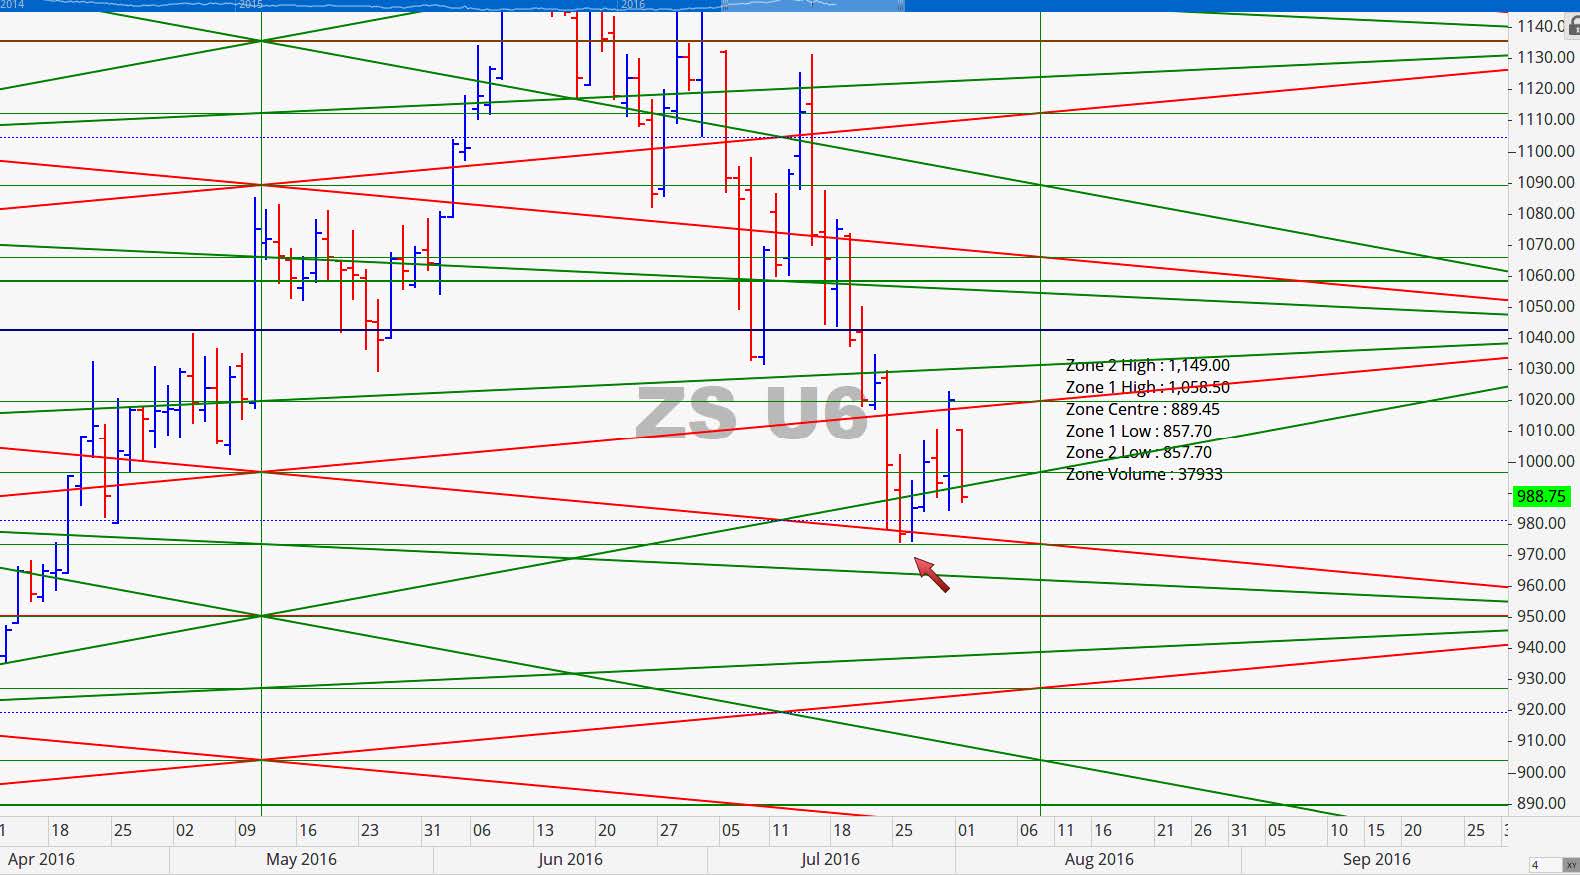
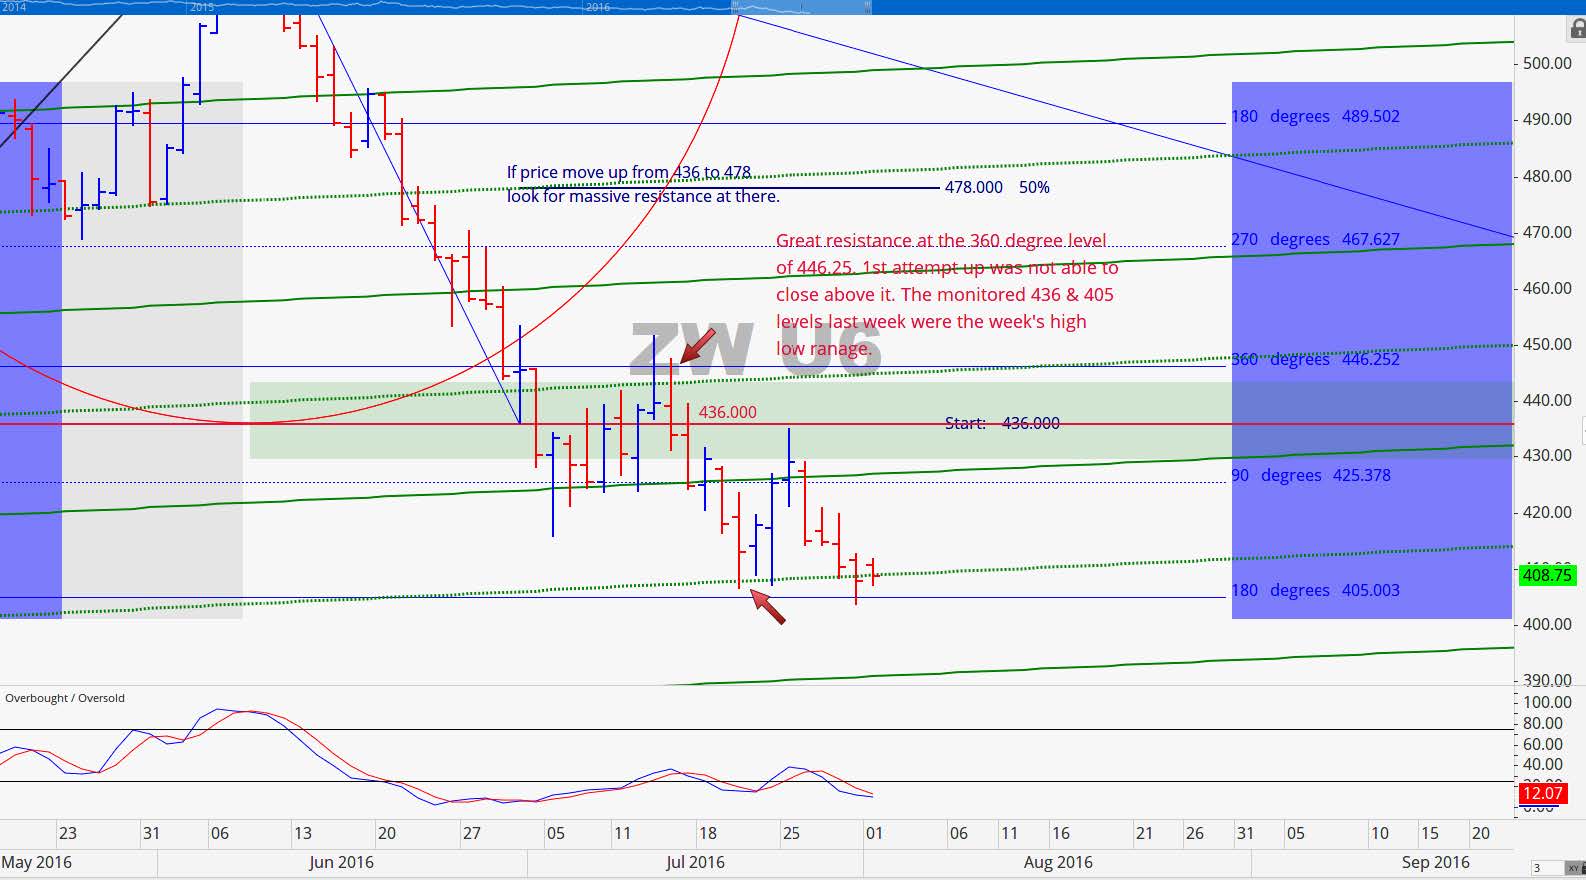
September 2016 Soybean Charts
September Beans has returned to our previously projected target zone and is very close to the 360 degree price level of 979. If this contract closes below 975 twice this week we believe that the price can reach 917.50 at a minimum next week. The price development continues to indicate weakness with key resistance overhead at 1042.50.
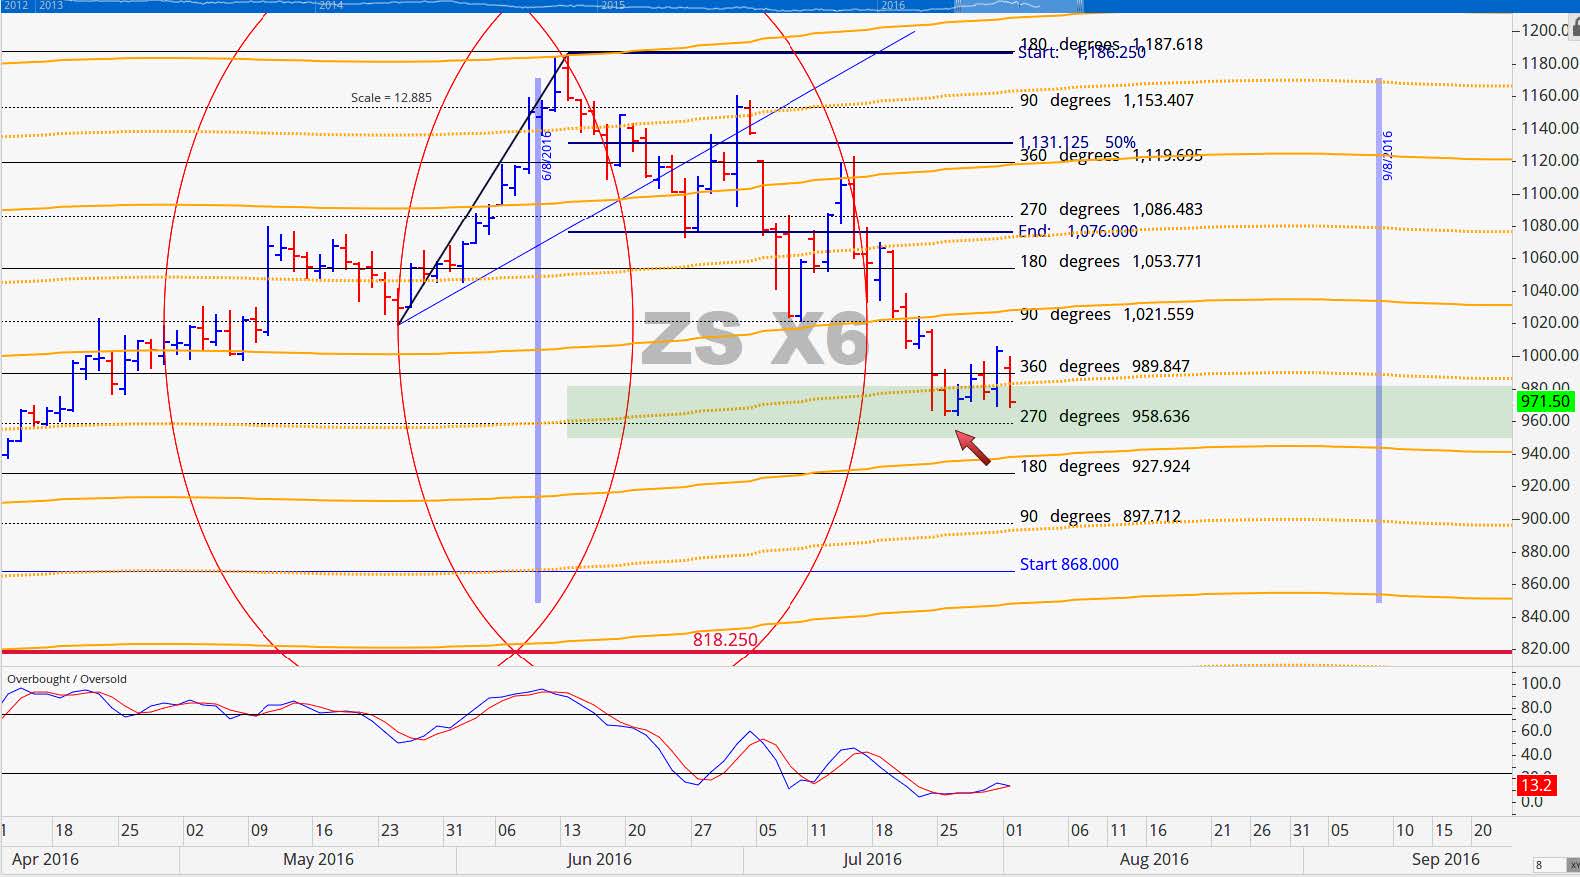
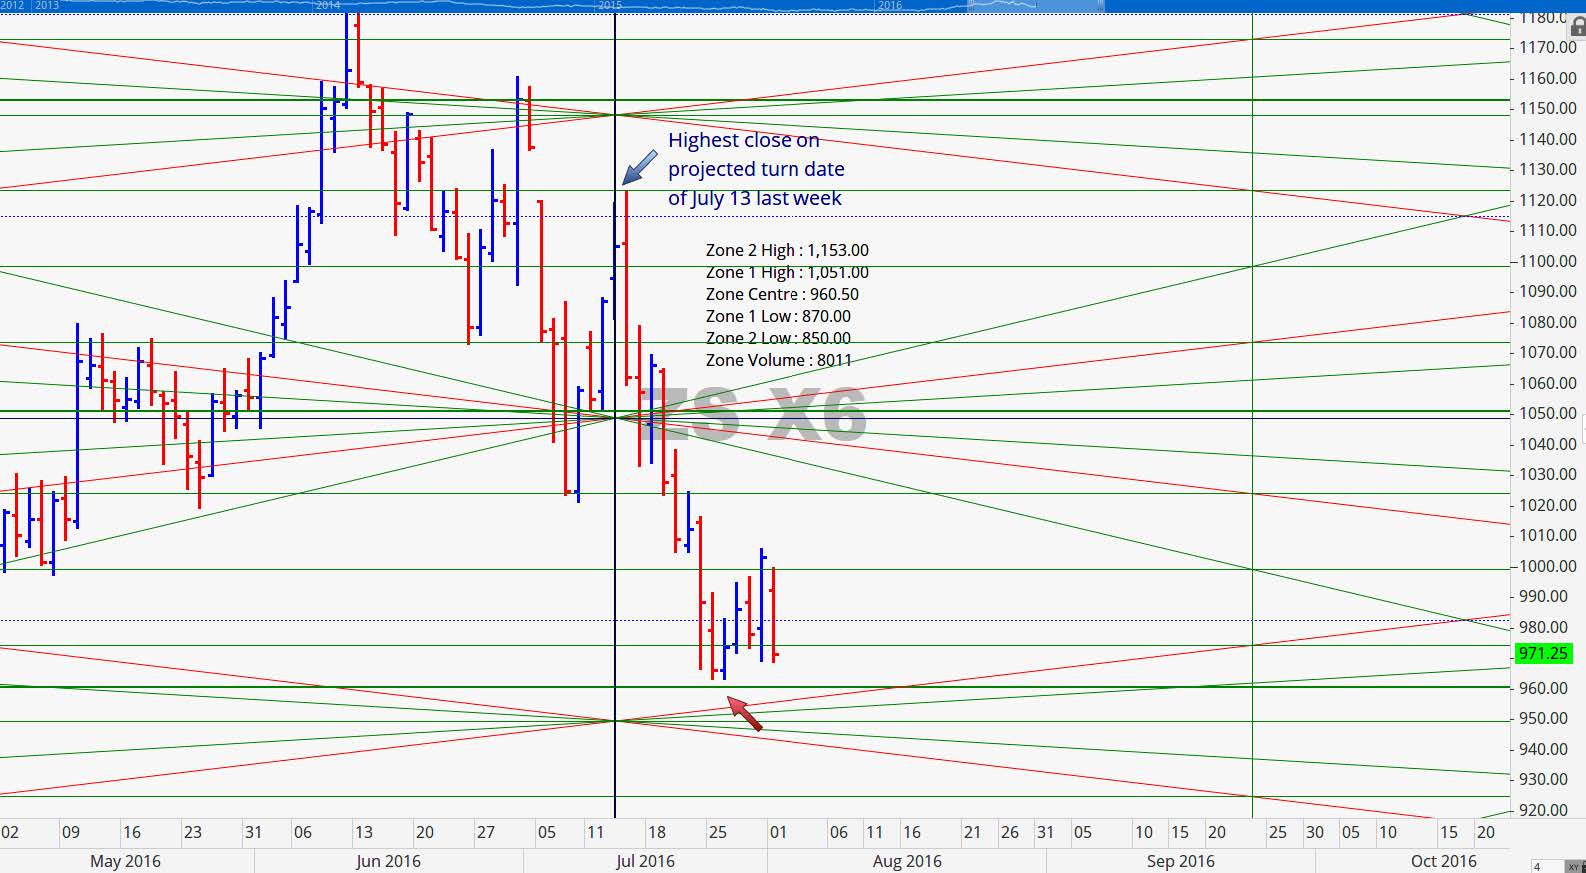
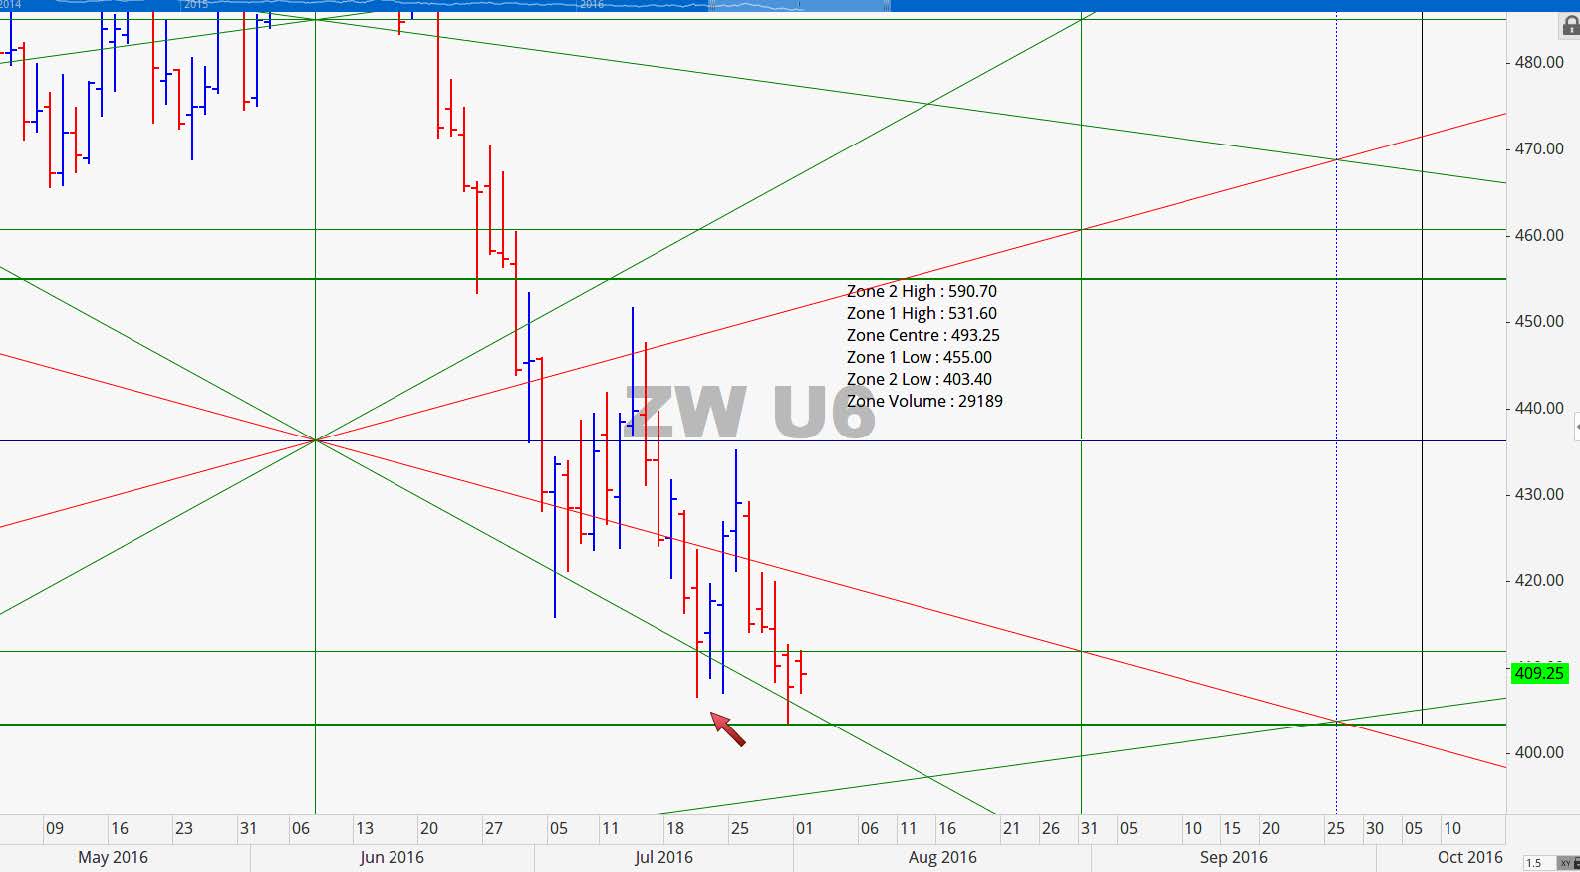
November 2016 Soybean Charts
November Beans did not make it to 958.75 last week but it only needed one more trading day to do so after making a low of 958.25 today. As mentioned previously, a move down to 928 would complete two full cycles from the 1186.25 high and that is where we are looking for this contract to go prior to coming off the board with the potential for a terminal move at about 900.
Grain Market Overview October 11
Read more