
Grain Market Overview March 30
March 30, 2016Grain Market Overview April 6
April 6, 2016Commodity Market News April 4

Summary
March was another strong month for the US labor market with jobs and wage growth increasing more than estimates. According to the Bureau of Labor Statistics' data released Friday of last week, there were 215,000 additional nonfarm payrolls added. Job losses continued in the manufacturing and mining sectors, which have suffered in part because of weakness in energy prices and strength in the greenback. Manufacturing jobs fell 29,000 to the lowest level in this economic cycle. The retail, construction and healthcare sectors found strength. The overall unemployment rate edged up to 5% from 4.9%.
The Prospective Planting Report was the catalyst that moved the needle in the Grain markets last week. The Corn market was hit the hardest with both the Grain Stocks and Prospective Planting Reports releasing bearish numbers for Corn.
Corn
Last week’s USDA Grain Stocks report showed Corn stocks at 7.807 billion bushels. This was the 2nd largest March Grain Stocks report since 1987. The Prospective Planting report showed 93.6 million acres estimated to be planted for Corn. This took the industry by surprise sending Corn futures down over 19 cents intraday on Thursday. Last week the May contract was down 16 cents and the December contract surrendered 17 1/2 cents.
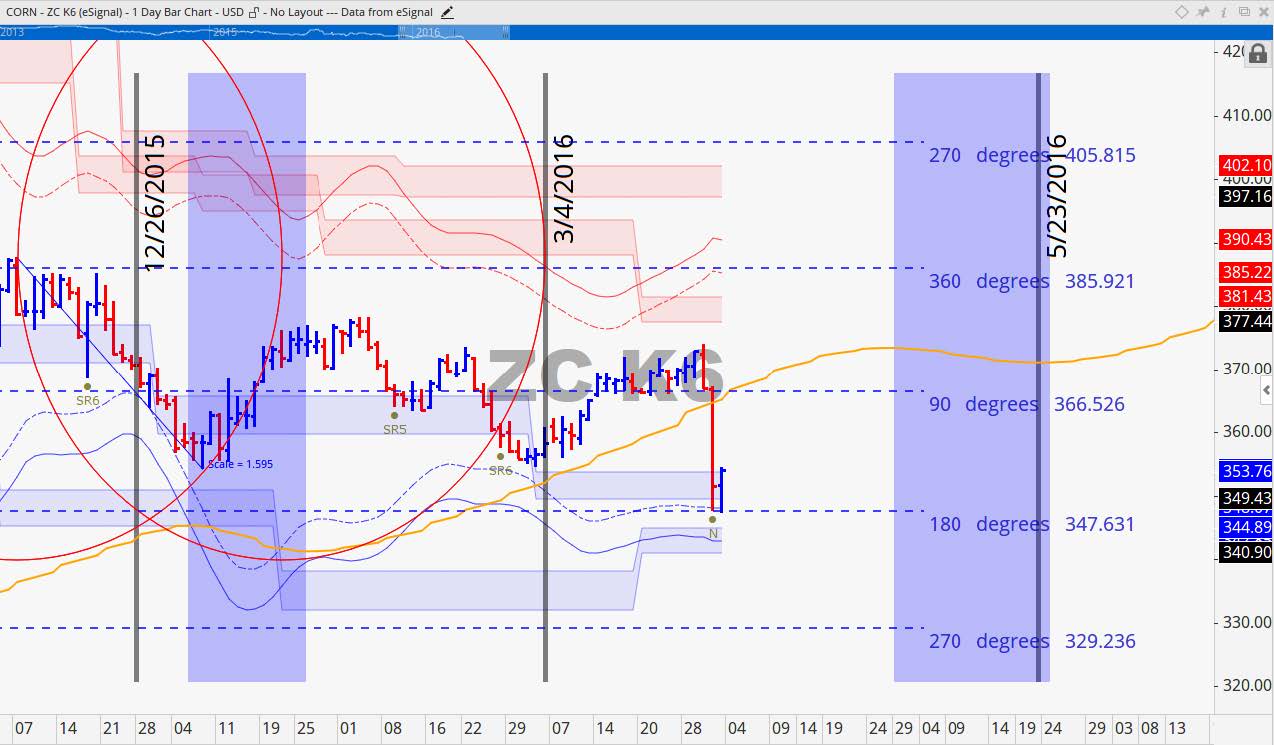
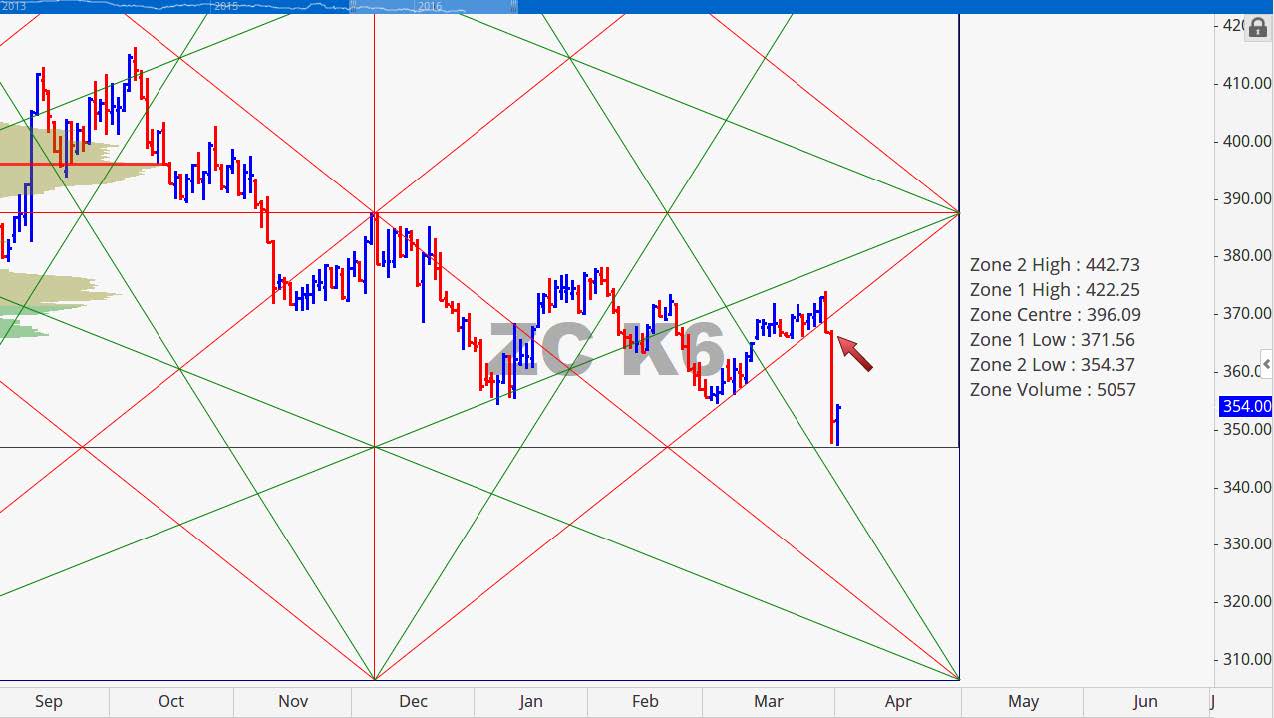
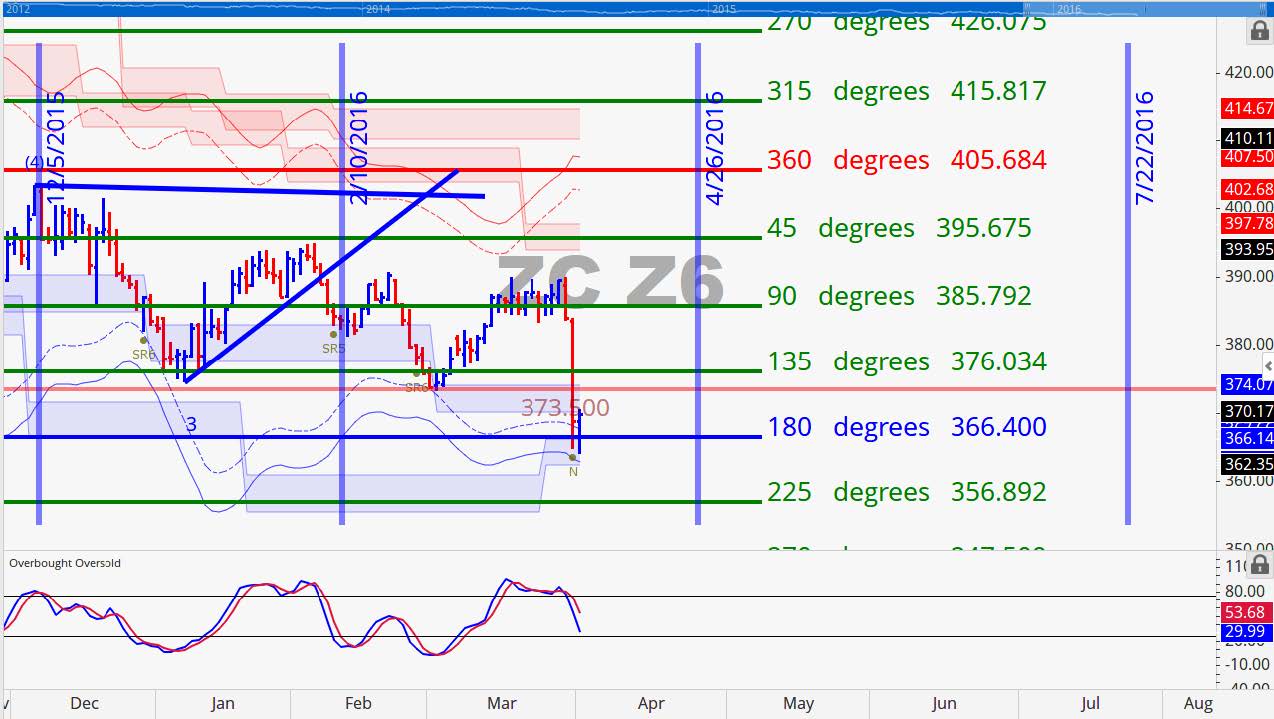
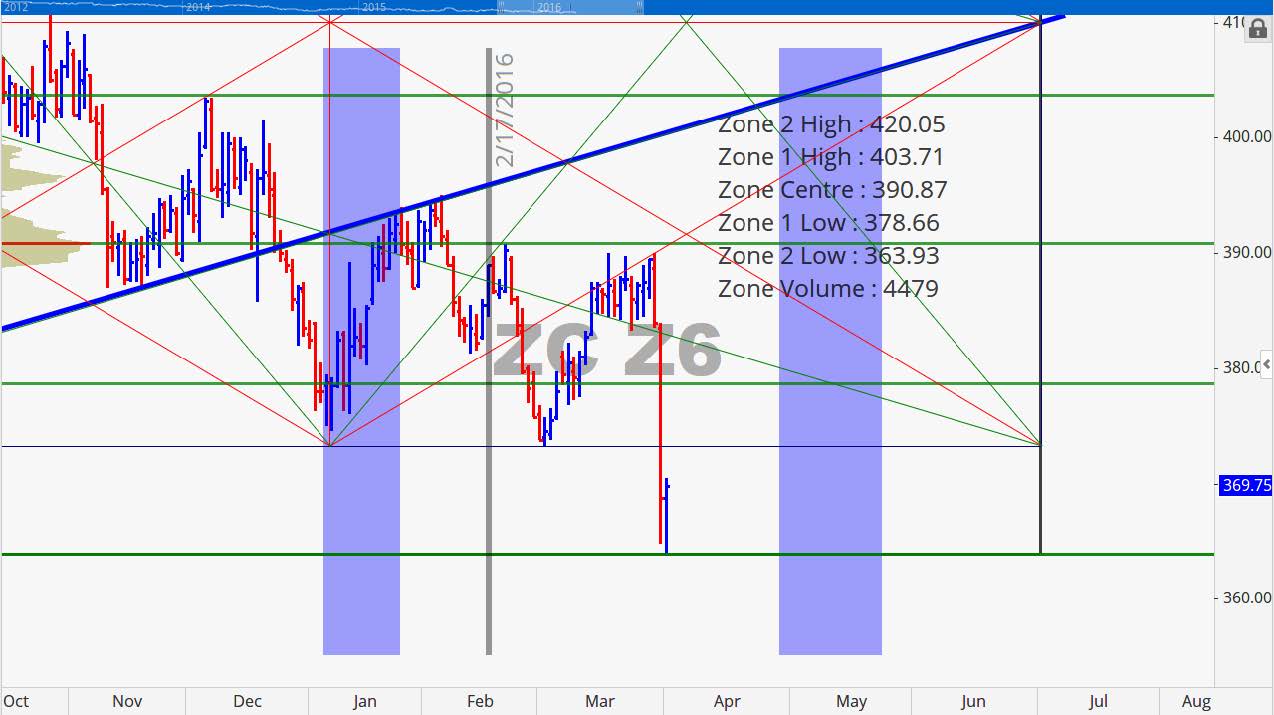
On the charts you will notice how Corn futures fell but found support at our predetermined support level at 180 degrees of price. The price level for the May contract was 347 1/2. It coincidently also hit a volatility based support level that was at the same level. The break to the downside started when prices broke below the 90 degree price level near the intersection of a natural trend line. In a similar fashion the December contract fell to a 180 degree support level of 366 1/2 at a volatility band. Corn will perhaps look to digest last week’s news. The next turning point that we are looking at for Corn is near April 26th. The weekly Crop Progress Reports start being released today each Monday. If the progress is good prices may move sideways for the next month rather than a strong decline.
May 2016 Corn Charts
Soybeans
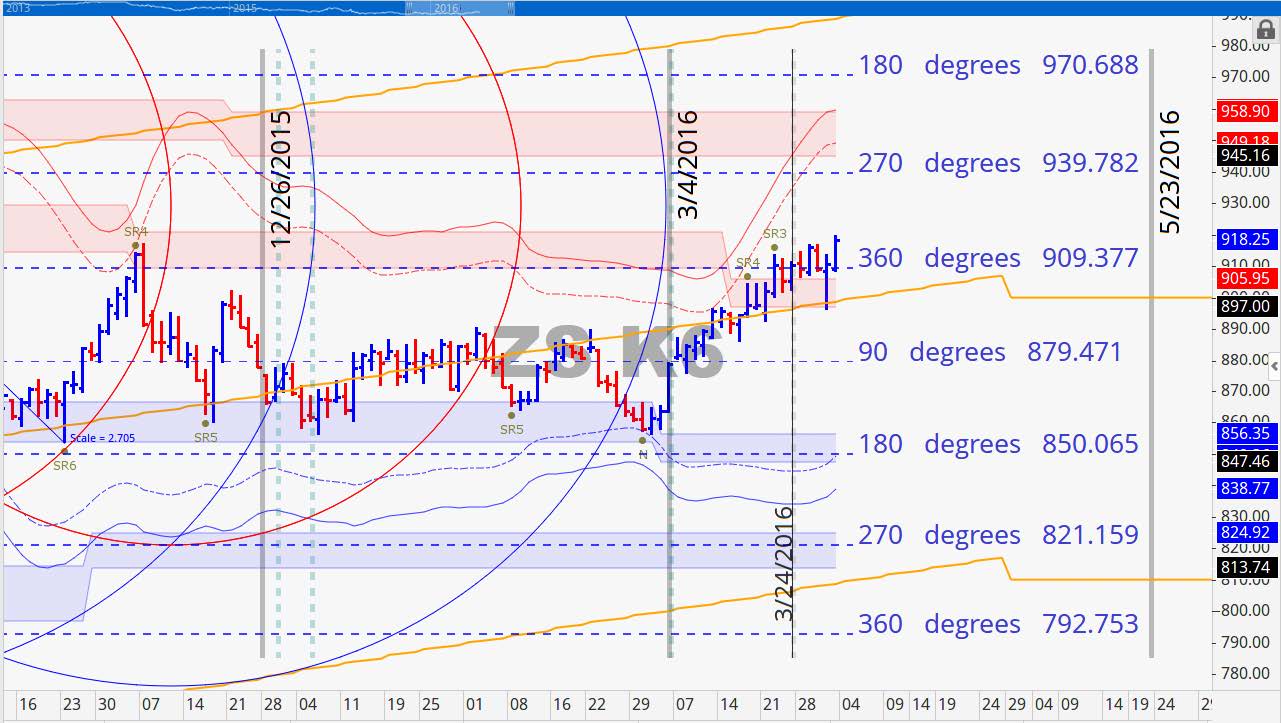
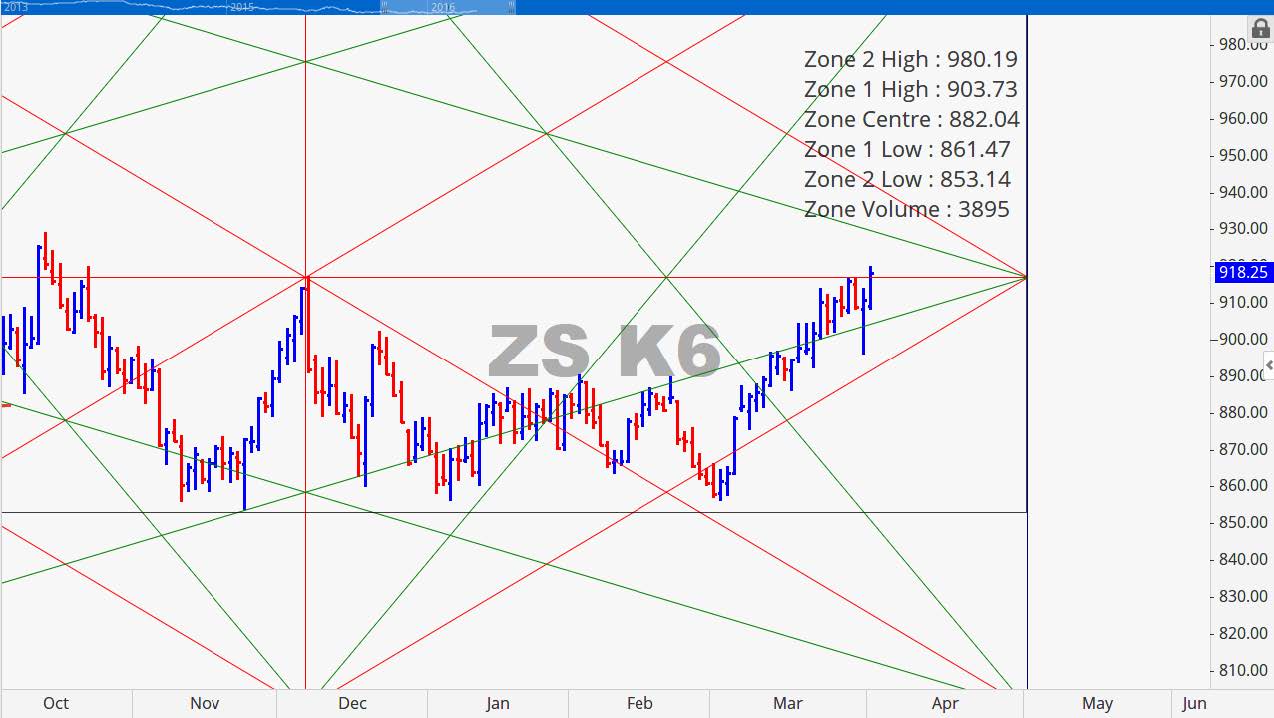
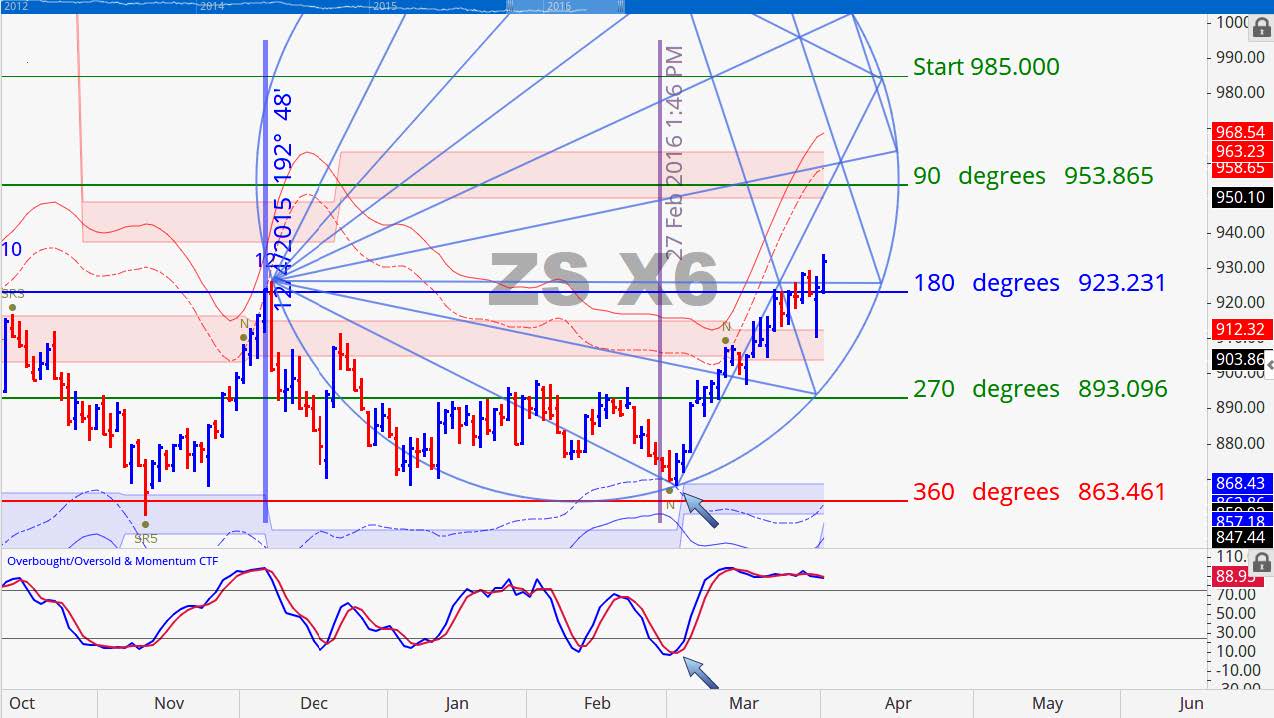
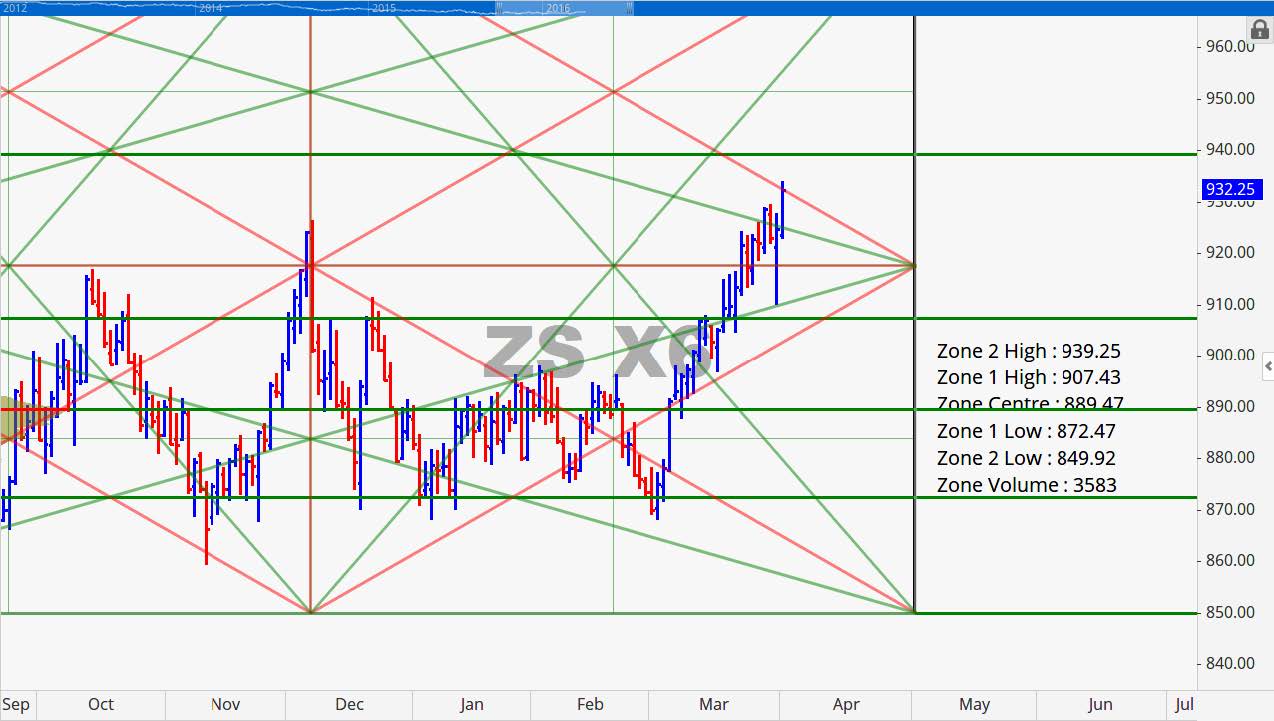
Corn initially pulled Beans down at the onset of the USDA report release but it soon recovered and continued to find strength through the end of the week. Soybean stocks were released at 1.530 billion bushels (BB). The March Grain Stocks report was the 3rd largest stocks results on record. The other two years that were higher were 2006 and 2007. The Prospective Planting Report showed a decline in Soybean acres planted coming in at 82.2 million acres. The acres planted number appears to have carried higher weight than the grain stocks number which made for some bullish sentiment in the Soybean market. According to the Commitment of Traders (COT) report it is starting to look like managed money is turning a bit bullish. Long positions held by managed money has edged up to 18.3% of all long positions which accounts for the largest number in over a year. It was 19.9% in January of last year. Additionally, managed money holds 9.1% of total shorts which reflects a drop in their short position holding. We are seeing signs that managed money might be anticipating near term higher prices. May Beans rose 7 ¾ last week and November Beans advanced 9 ½ cents. Prices recently broke through resistance at 360 and 180 degree of price levels respectively as evidenced on their charts. If they stay above those levels this week prices could find some strength.
May 2016 Soybean Charts
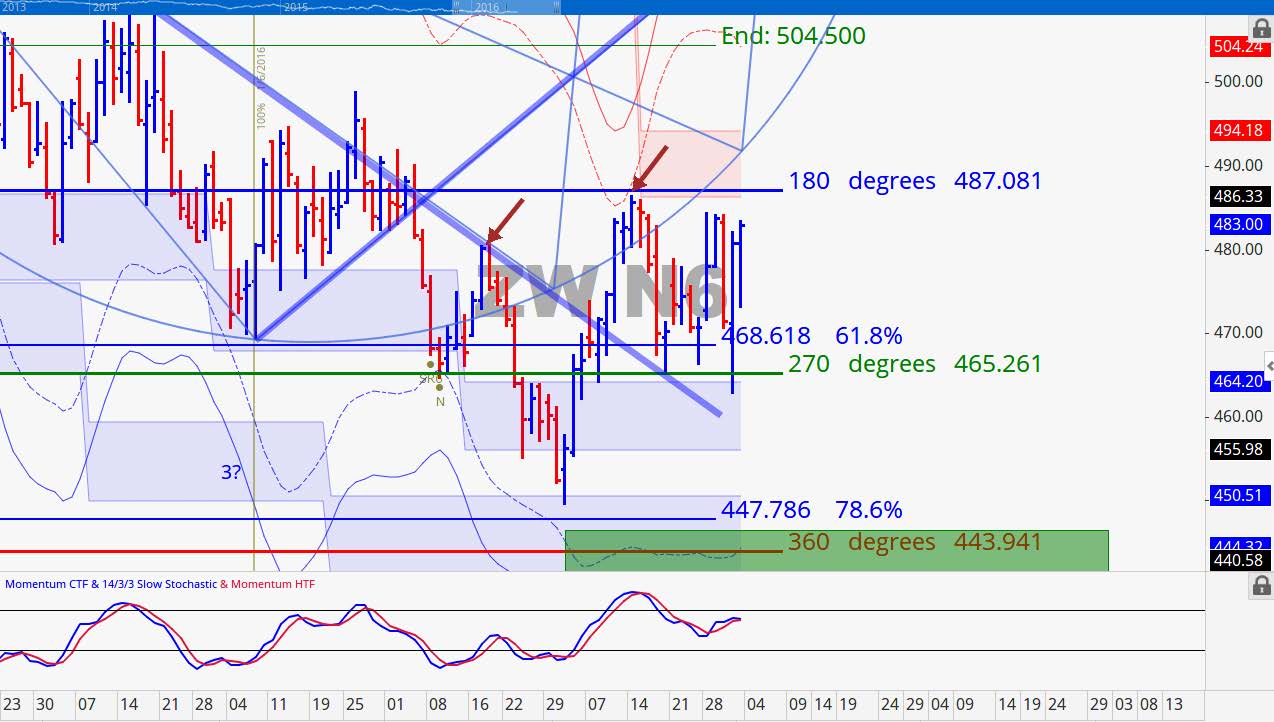
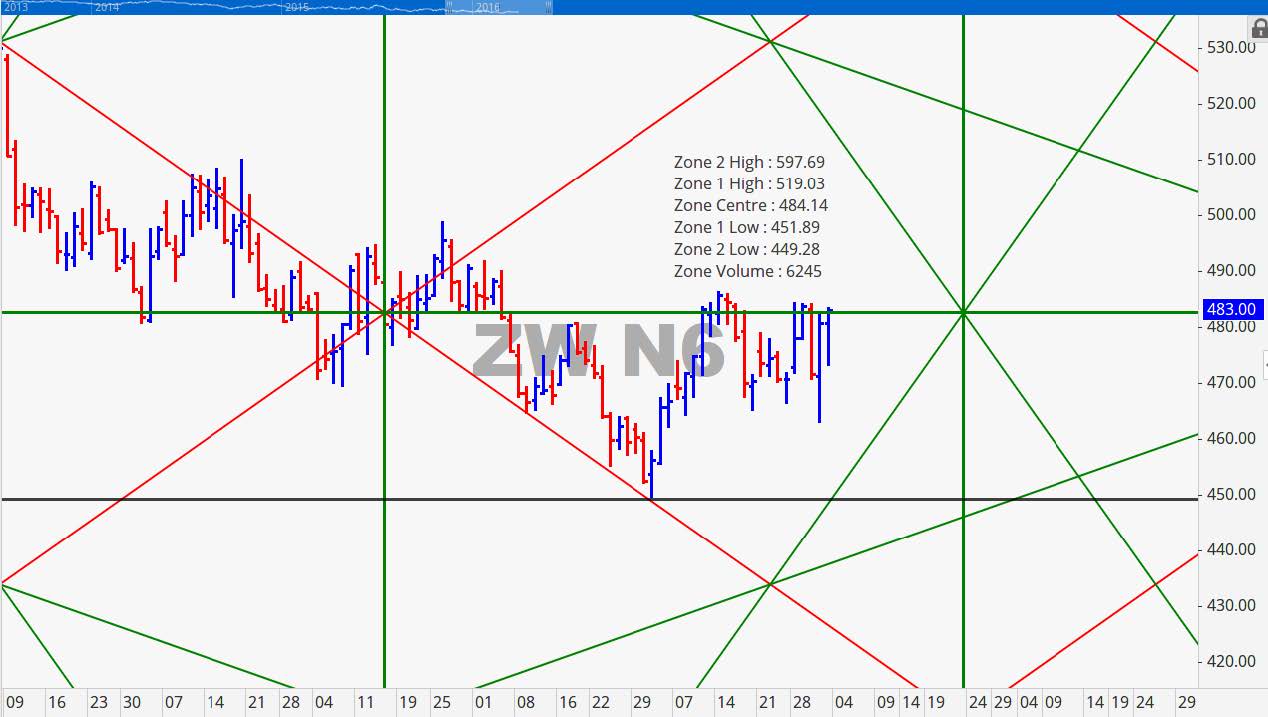
Wheat
Ukraine announced that they anticipate exporting record amounts of grain this year. They are already on record for having shipped nearly 13 million tons of Wheat and 13 million tons of Corn. Planted acres were just shy of the low end of expectations which came as a surprise to the market. The acreage of 49.6 was the 3rd lowest acreage total on record and the lowest dating back several years. July Wheat closed the week in strength but we anticipate that it will give back some of its recent gains that stemmed from the USDA reports. The focus of market participants will probably shift back to the impact of the weather. Currently there are not many issues at hand for the start of the month. Last week July week gained 12 ¼ cents. We currently have volatility resistance of 486 ¼ and a 180 degree price resistance level of 487 over head. We anticipate it will continue to struggle at those levels.
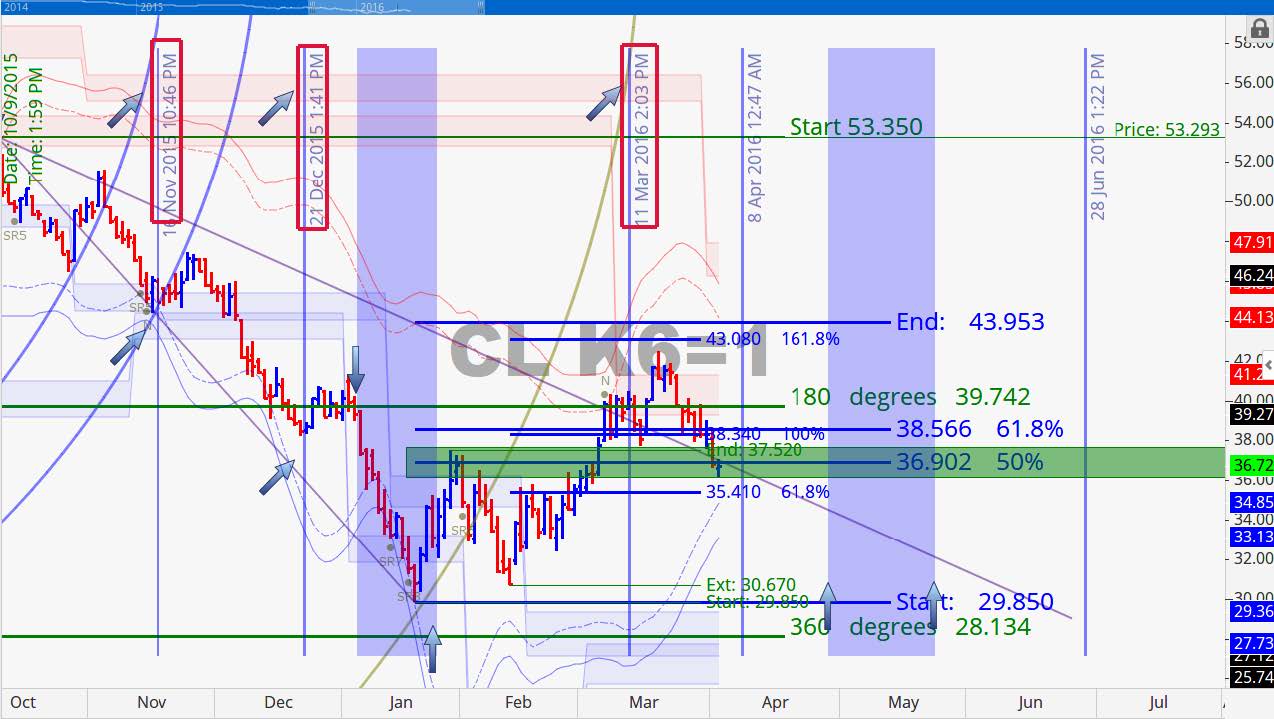
Crude Oil
May Crude Oil futures fell 6.77% (2.67 points) last week. It looks like it will be falling into our potential April 8th time cycle timeline. If prices hold above 34.41 near the time cycle we would not be surprised to see a move the quickly races to our 43.95 minimum price objective. In the event that this contract come off the board prior to such an advance we would simple roll the analysis over to the next contract. The Saudis have gone on record stating that they would not freeze production if the other major countries fail to freeze as well. We already know that Iran has no plans to do so given that they are only recently had sanctions lifted.
Grain Market Overview October 11
Read more