
Grain Market Overview April 13
April 13, 2016Grain Market Overview April 20
April 20, 2016Commodity Market News April 18

Summary
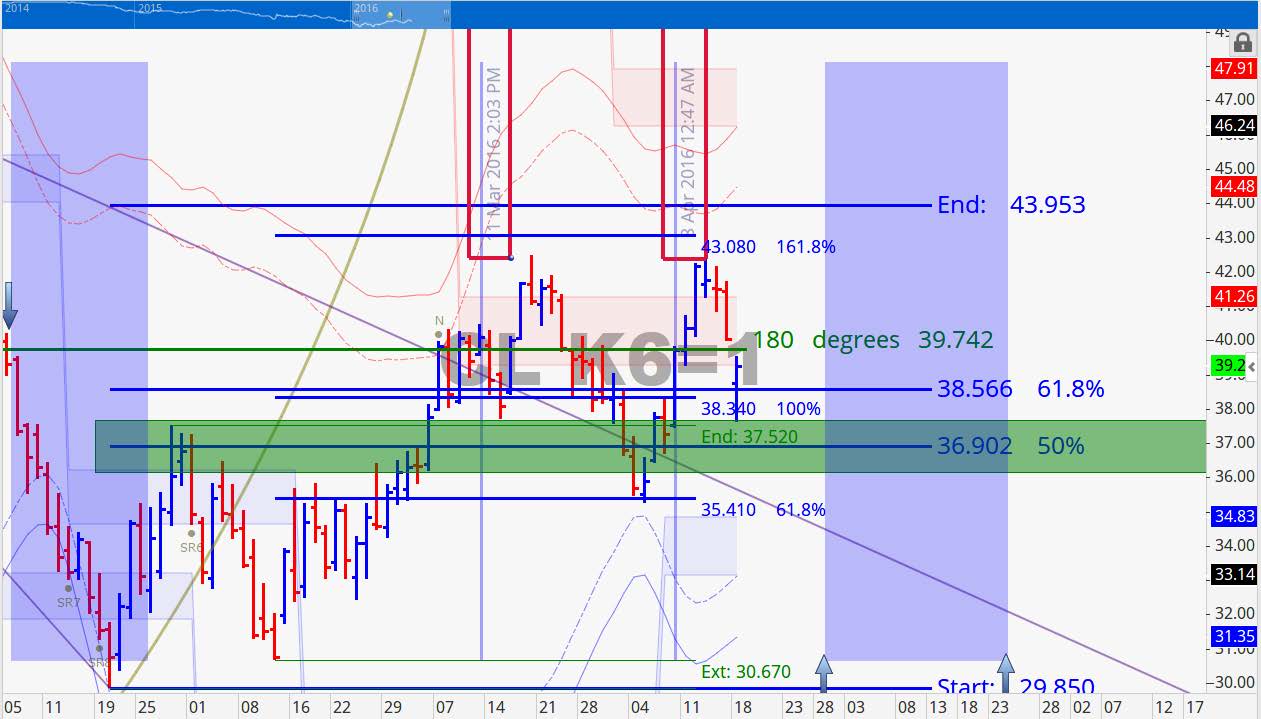
Crude Oil was hard hit over the weekend dropping 2.35 (7%) when the major oil producing nations that met in Doha failed to reach an agreement that would curb Crude Oil production. Media outlets are reporting that an agreement was close but progress broke down amid tensions between Saudi Arabia and Iran. As we have shared with you in the previous newsletters, Iran has made it clear that it has no intention of freezing production until it gets back to pre-sanction levels. Crude Oil is proving to be resilient however as it has been moving higher off the announcement low erasing most of those loses by mid-morning on Monday.
The G20 finance ministers and central banker meet over the weekend. Indications are that the pulse of the meeting was less negative than the previous February meeting. The participants are still concerned about ongoing risk in the global economy and all eyes will be on Fed Chair Janet Yellen and what has been her hawkish position on the greenback.
On Sunday evening, April 17th, Brazil’s lower house of Congress voted to impeach President Dilma Rousseff. The lower house well exceeded the two third majority needed to move the impeachment process forward to the upper house where it is expected to pass as well. The Brazilian currency had been garnering strength in recent weeks in anticipation of an approved impeachment but the Real was down sharply after the vote and during overnight trading.
Speculation is growing that Brazil could start importing Corn from the United States if the Brazilian government temporarily eliminates the 10% import tariff for Corn brought in from outside the Mercosul trading block. It all but seems assured that the tariff will be lifted making it feasible to import US Corn into northeastern Brazil. The potential price of US Corn would also be influenced by the currency exchange rate between the Brazilian Real and the US Dollar.
Corn
The May Corn contract rallied 16.25 (4.49%) and the December contract rallied 13.25 (3.53) last week. According to the Crop Progress report Corn planting began last week and is currently 4% complete. The WASDE report showed a bearish increase in the ending stocks forecast which came in at 1862 MB up from the 1837 MB previously reported. The Commitment of Traders Report showed managed money still has twice as many short positions as long positions. Managed money holds 10.6% of all Corn long positions while also holding 20.6% of all short Corn positions. The fundamental narrative continues to show that the supply side inventory is bearish. Corn futures is not hesitant in returning to previous resistance levels and is holding serve just beyond 380 on the May contract and near 390 for the December contract. Current price levels are very critical in that we could see a small continued advance if the market chooses to probe for buy stop orders.
Our cycles continue to point to a potential sideways declining market through the end of June with a price target of 350 for the December contract. On April 1st the market hit that target level so it conceivable that Corn could continue sideways to slightly up because the price forecast hit so early.
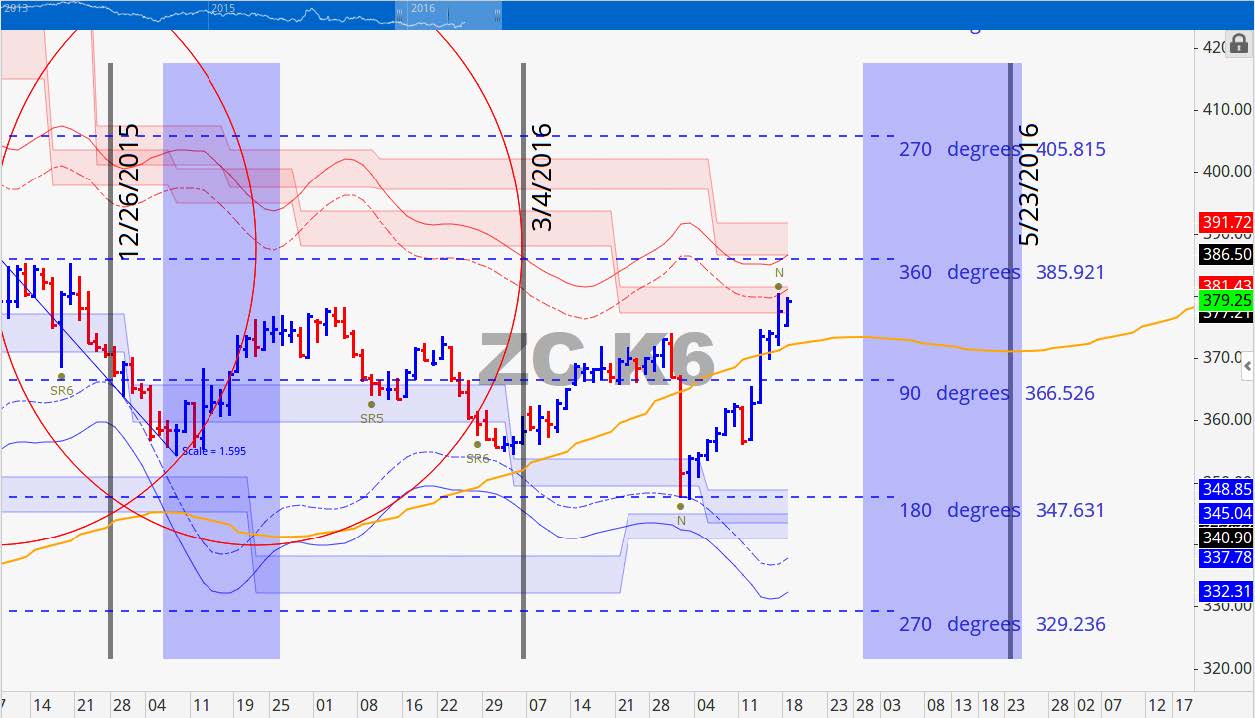
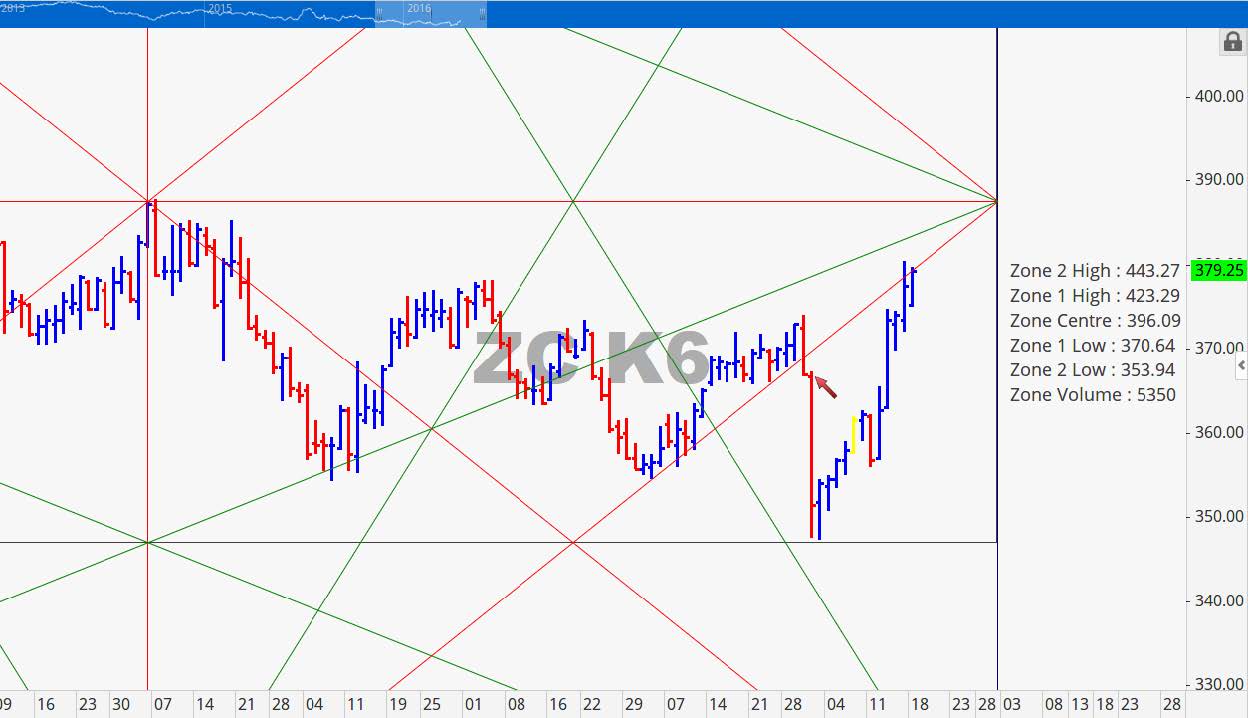
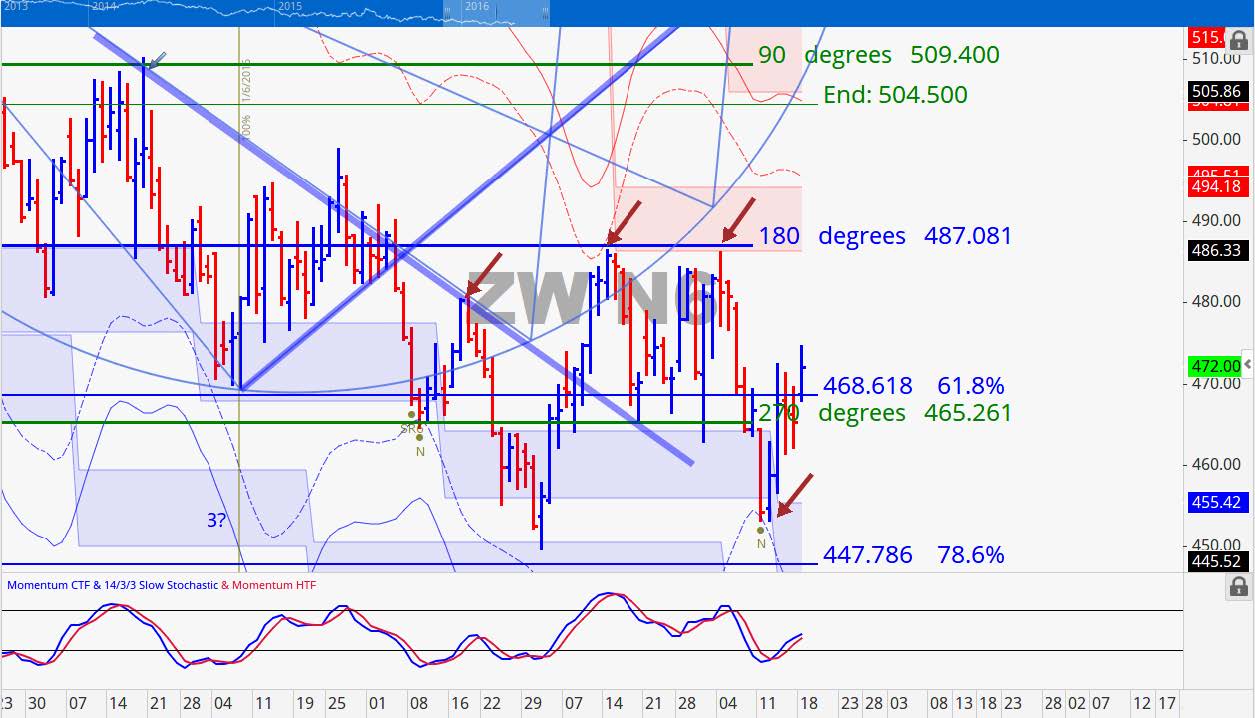
May 2016 Corn Charts
It is reasonable to expect the large supply in the Corn market would eventually cause prices to turn back down. We are looking for May Corn to not get much higher than 405 between now and when it comes off the board. We have seen an amazing run the past two weeks and our view is to play whatever hand the market deals to us. Right now is it prudent to take advantage of these inflated prices and lock in some gains if at all possible.
In the chart at right we can see that we are up against volatility based resistance. We also see that the end bands are turning or starting to slope upward. Momentum can carry this price slightly higher but the 387 and 400 levels should prove to be formidable.
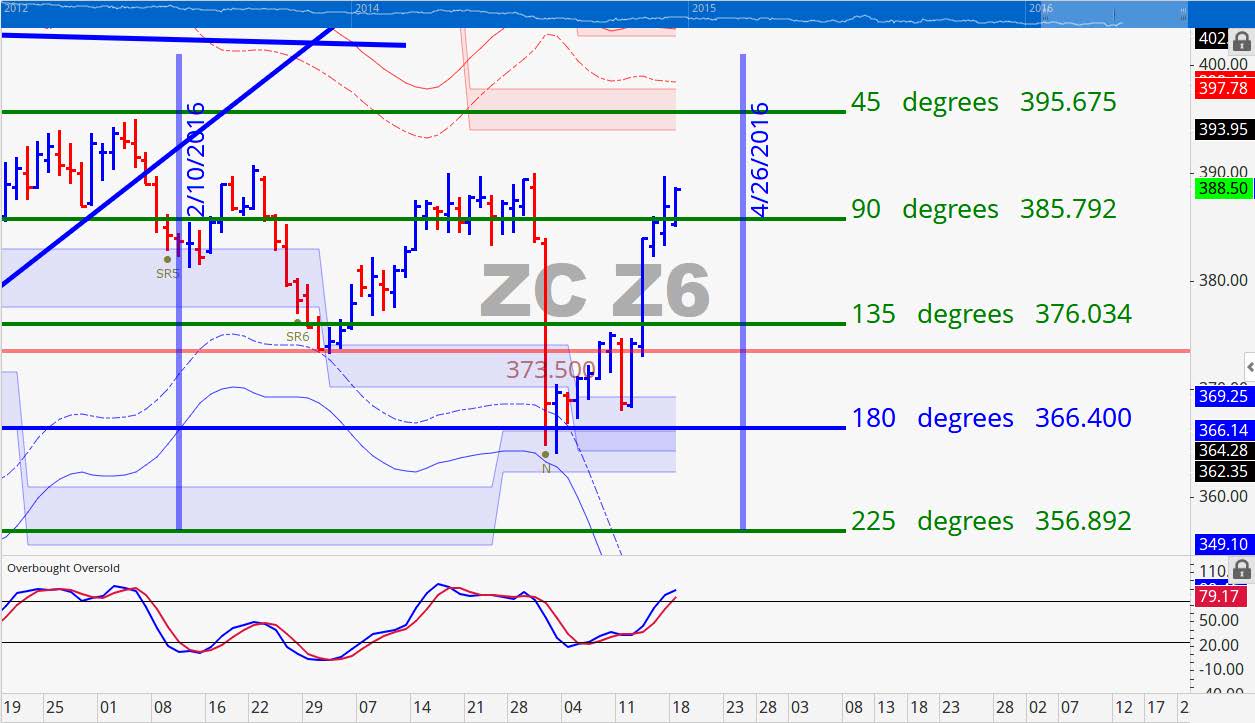
December 2016 Corn Charts
The December are firmly above the 90 degree mark and it looking to touch the 45 degree mark at a minimum by the end of the week. The 360 degree mark overhead is 406.75. This is going to be the level that truly defines make or break this contract. We have a cycle time line of April 26th as a potential energy marker where a price pivot can occur. This contract is also over bought so if it is to sustain higher prices it is going to need to hold above 396 this week changing the technical narrative to the upside.
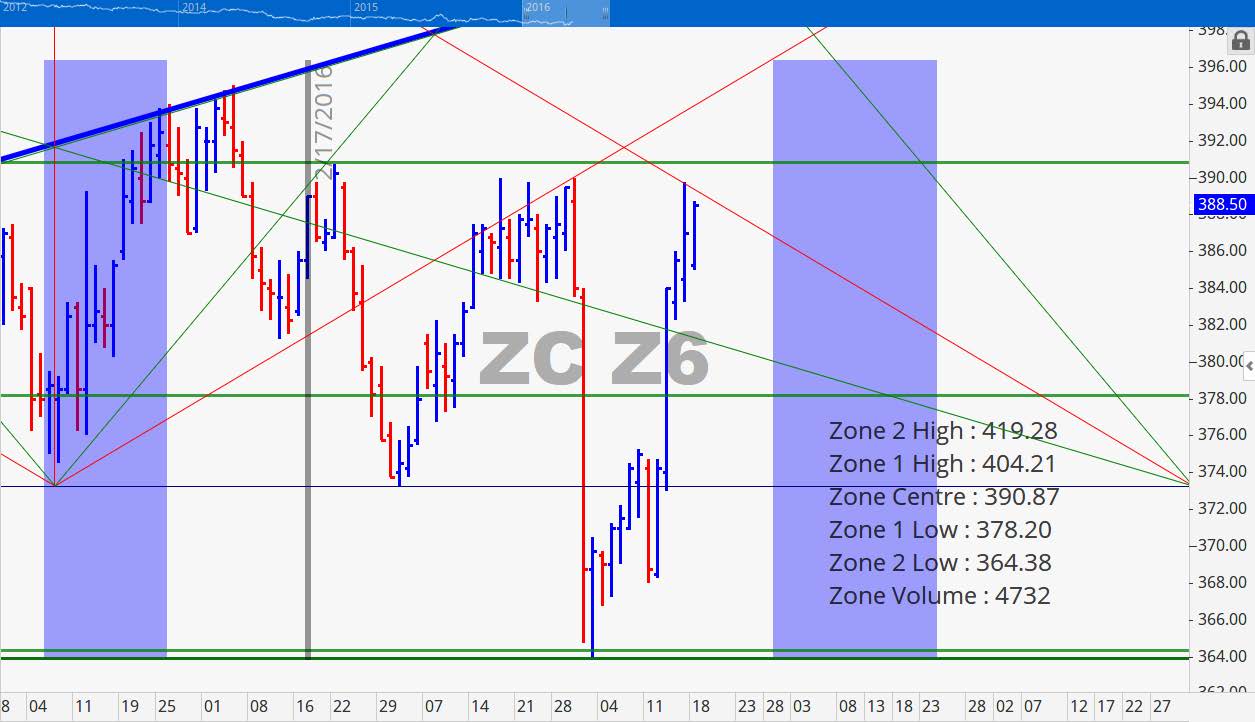
The high on Friday last week was 392 the point of rest at 391. Notice how the market fell from the red natural angle on March 30th. The two week sideways move it made leading into the final top on the 30th could be the type of price action we see over the next two weeks where this contract moves up and bounces between the red trendlines above.
Soybeans
Soybean futures maintained a strong rally last week with the May contract gaining 39.25 (4.28%) and the November contract rising 36 (3.87%). Last week’s Crop Progress report showed that Corn plantings had begun but that was not the case for Soybean plantings. The WASDE report released last week showed a surprise decline in the ending stocks number which came down to 445 MB compared to the previously reported 460 MB. This is still significantly larger than the carryover from last year of 370 MB but the surprise was oddly enough to help move prices higher. The real reason for the Soybean rally can be linked to funds are buying Soybean futures with the expectation of crop problems this year during the growing season over the summer. This funds are thereby betting against the fundamental narrative that remains bearish because of plenty of supply.
May 2016 Soybean Charts
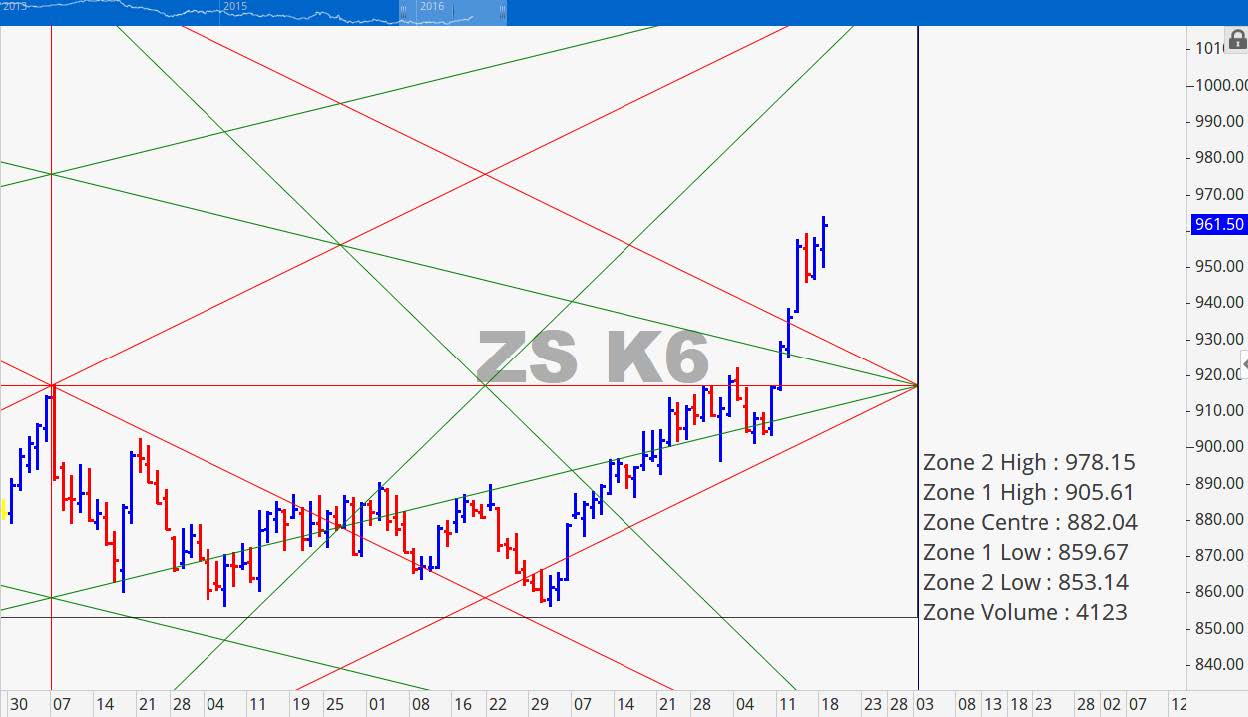
Our cycles are calling for a top in the middle of May followed by a slightly higher top at the end of May. We are looking at prices potentially getting to the 1000 level or even testing the 1034 level. Both of these levels should prices reach there are very high and not sustainable. A rapid decline from those price points would be very likely in our point of view.
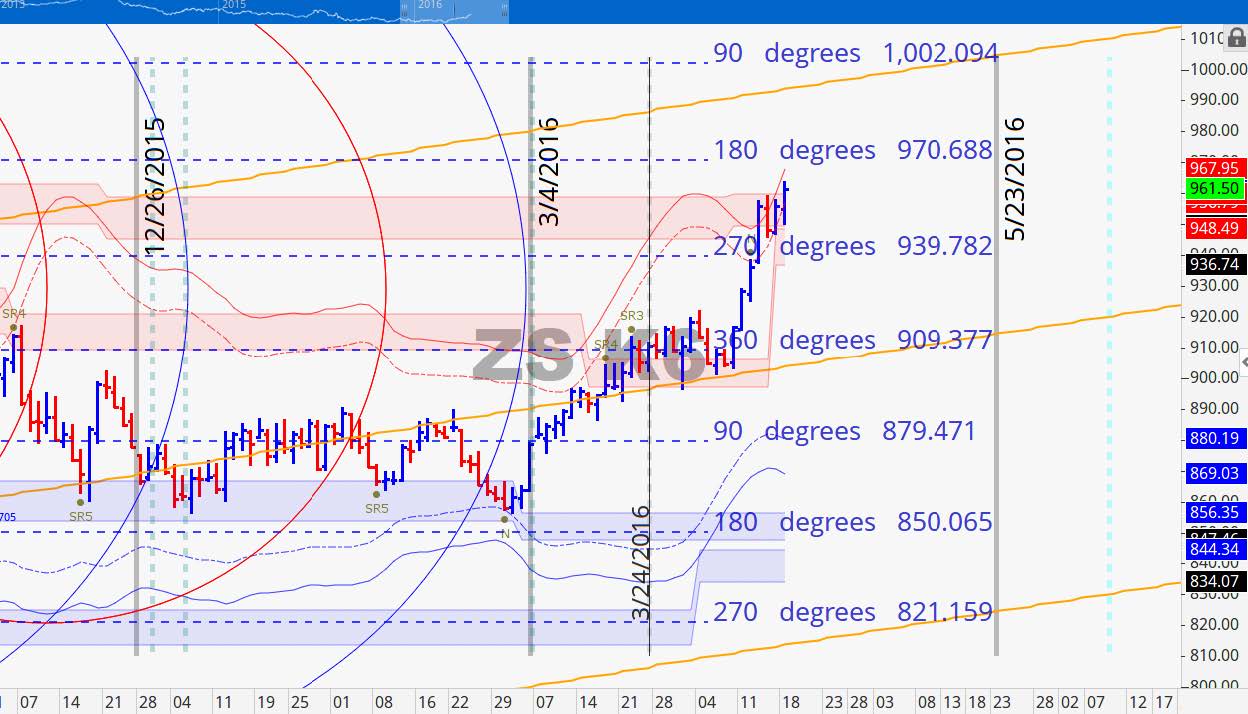
Two standard deviations above our point of control rests at 978.25 this week. This should be viewed as the key resistance zone for the week. Price consolidated at the red horizontal natural support/resistance level then catapulted from there. We have free space overhead so the 978 are will be very important his week.
November 2016 Soybean Charts
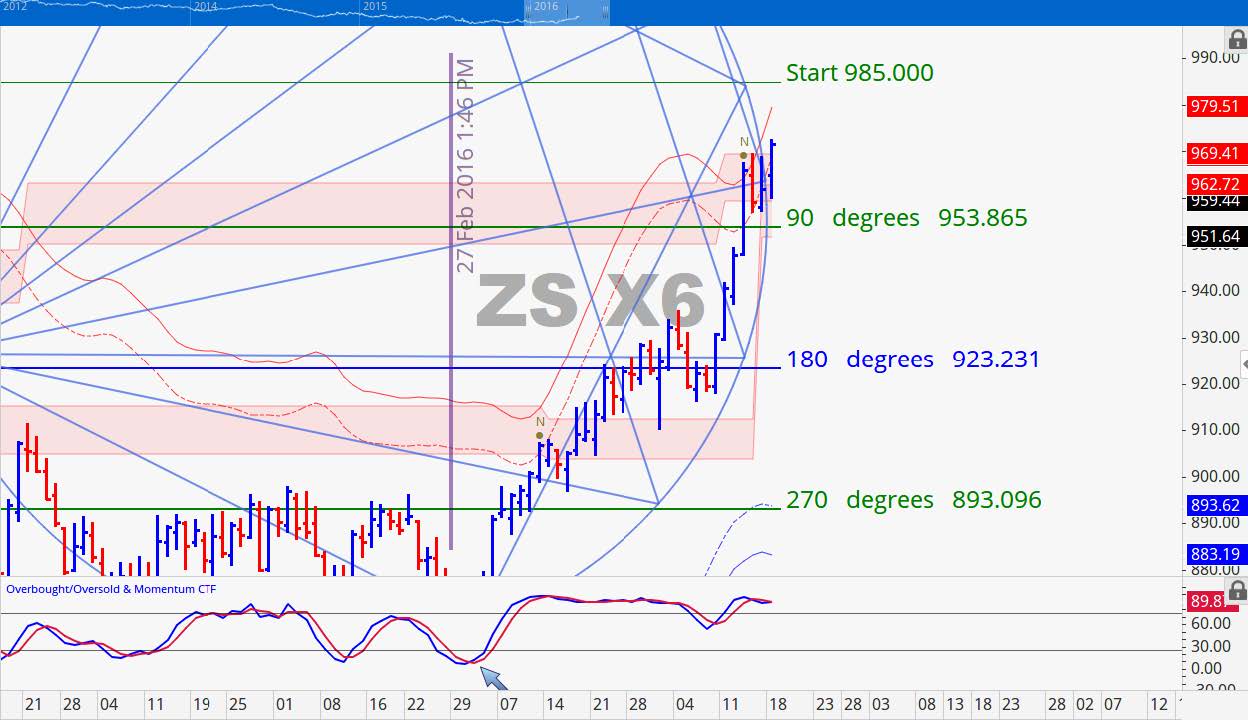
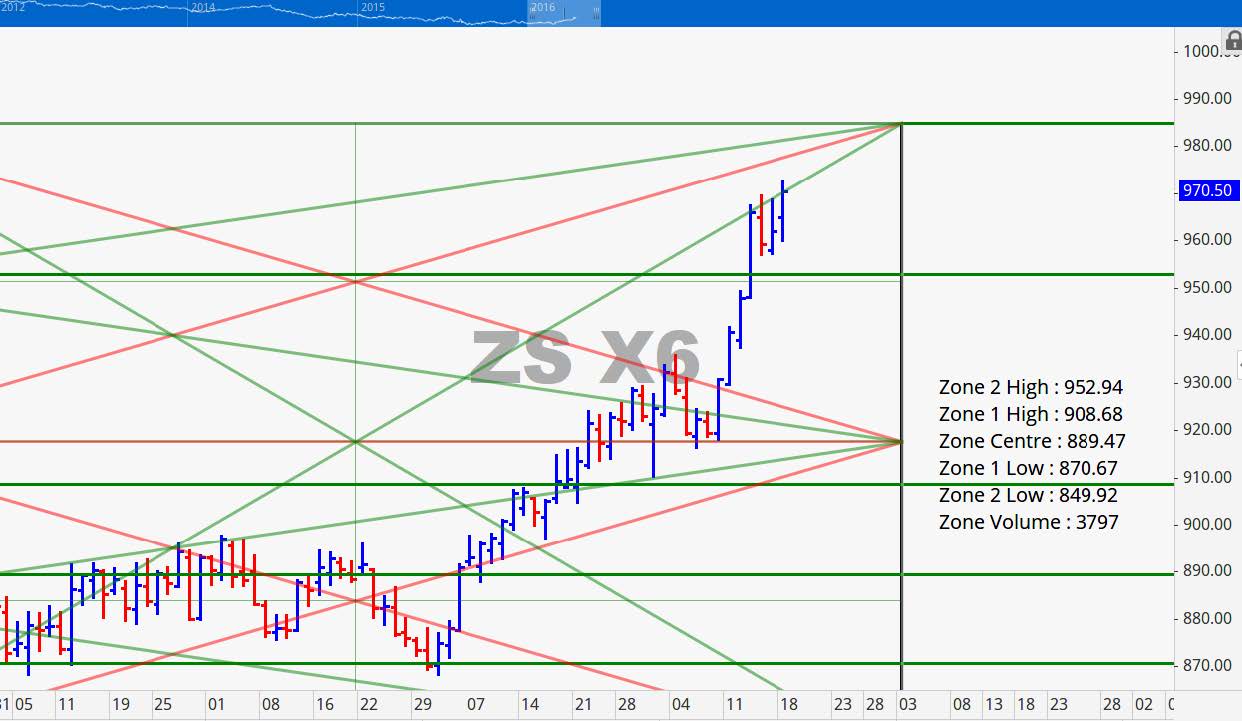
The November contract is firmly situated at volatility based resistance. The top side of that resistance band is at 969.50. The pattern that is developing is potentially another continuation pattern to the upside. The last major top that was made was at 985 on July 14th last year is currently very close to that level. We are at the edge of our geometric circle that can also serve as an energy point were the market reversed or accelerates. The next couple of days will be key in determining a response to this time horizon.
Grain Market Overview October 11
Read more