
Grain Market Overview April 6
April 6, 2016Grain Market Overview April 13
April 13, 2016Commodity Market News April 11

Summary
The US Dollar is at its lowest levels since October 15th of last year. The October low was 93.806 with current prices reaching down to 94.011. If the USD were to break the October lows downside follow through would be expected and a case for better export opportunities could be made which could in turn possibly help support grain prices.
The day prior to the USDA reports that sent Corn futures plummeting down, May Corn futures made a high of 374 1/4 Two days later it make a low of 347 1/4. Since making that low it has posted six consecutive days in positive territory. It is important to note however that it has only been able to recover just shy of 61.8% of what it gave up in three days suggesting that it is still in a weaker position overall. The larger than expect drop has prompted concern among producers leading to speculation that producers might be switching some acres to Soybeans when planting begins. The weather outlook through the end of the week is calling for below-normal moisture and below-normal temperatures for the Midwest.
Soybean futures finished the week down only 1 1/2 cents but that was largely due to Friday's 12 1/4 cents (up 1.35%) move. Friday's advance was its largest point move since March 4th. The strength in the Crude Oil market contributed to the strength that we saw in Beans. Additionally, forecasts calling for cold weather is expected to potentially delay the start of the spring planting. Two important reports for the Soybean market this week are the WASDE report on Tuesday and the NOPA crush report on Friday. Tuesday's report will shed some light on the South American production numbers and give us an update on the domestic supply and demand data. Estimates are looking for a slight increase for the Brazilian and Argentine Soybean numbers.
Better than expected crop ratings for the Wheat market led to lower prices for Chicago July Wheat futures. Trade estimates were looking for 57.5% of the US Winter Wheat crop to come in as excellent grade versus the actual of 59%. Only 7% was reported in poor condition. Last year's rating was at 44%. Last week's rating of 59% was the highest rating in 4 years at this point in the season. Detrimental weather and a reduction in planting acres could lead to significantly lower Wheat production from the Black Sea region. Russia, the Ukraine and Romania are all estimating lower production number compared to last year. Russia is down 5 million tons, Ukraine is down 9.2 million tons and Romania is down 2.5 million tons.
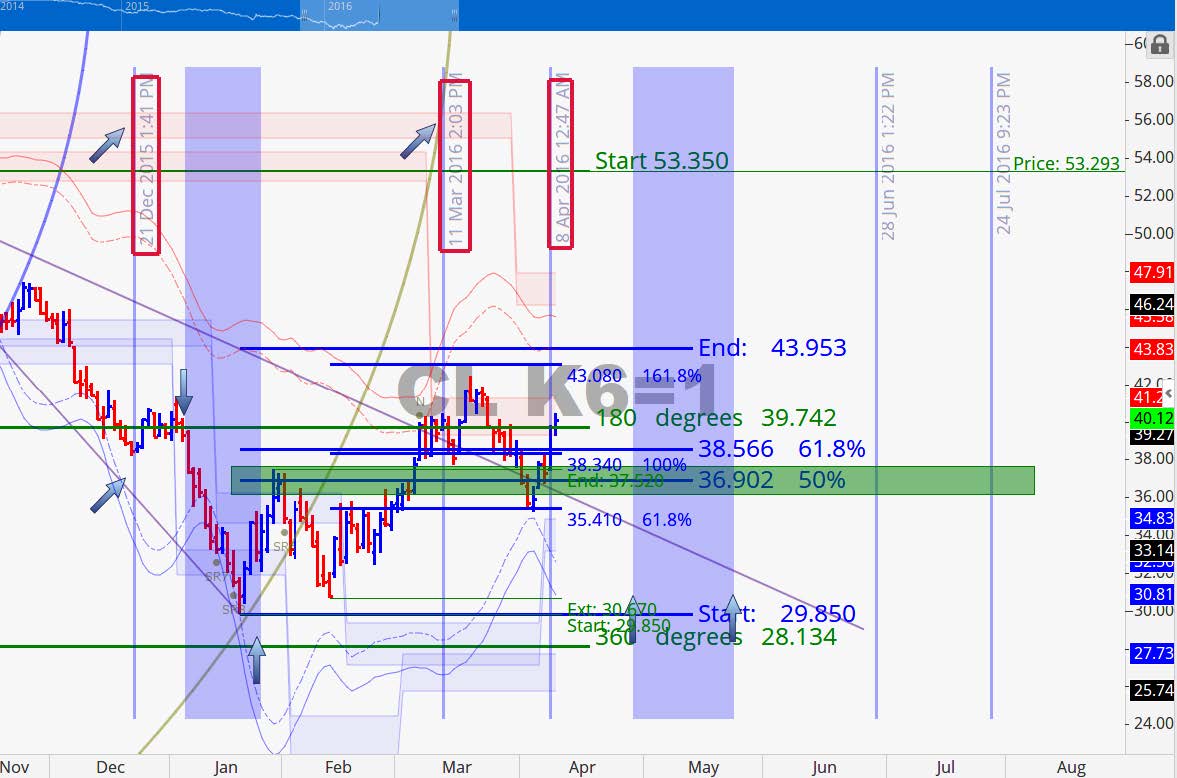
All eyes turned to the Crude Oil market on Friday of last week when Crude futures went on a massive run to the upside that began about noon EST. It opened at the day's low and finished near the day's high while at the same time posting is largest trading range since mid-February. It was a 6.6% gain on the day (2.46 points per barrel advance). Rumors continue to circulate that OPEC might finally be getting closer to a freeze but there is not concrete evidence as of yet.
Saudi Arabia has taken steps to slow Iran's efforts at increasing oil exports by banning vessels that transport Iranian crude from entering their waters. Iran has only been able to sell small volumes of Crude Oil to Europe which included barrels that have be sold to Spain's CESPA, TOTAL of France and Russia's LITASCO. Iranian vessels carrying the country's crude are restricted from entering ports in Saudi Arabia and Bahrain, according to a circular sent by a shipping insurance company to its members in February. The slide that we saw in Crude Oil prices over the past three weeks appears to have abated. After a slow start last week Crude managed to finish the week up 2.92 points per barrel (up 2.92%).
Corn
The May Corn futures contract was up 8 1/4 cents (2.33%) on the week. The December contract gained 5 1/2 cents (1.49%). The selloff from the March 31st planting intentions report is starting to look like an overreaction. Sometime when markets fall too fast time needs to catch up with price which suggests that Corn futures could be range bound for the next 6-8 weeks. Resistance at 380 and support at 340 are potentially very good boundaries for May contract and equivalent of those levels for the December contract would be 400 to 360.
According to the COT Report, Managed Money ended last week net short 175,604 contracts. That was an additional 59,102 contract short position from the previous week.
May 2016 Corn Charts
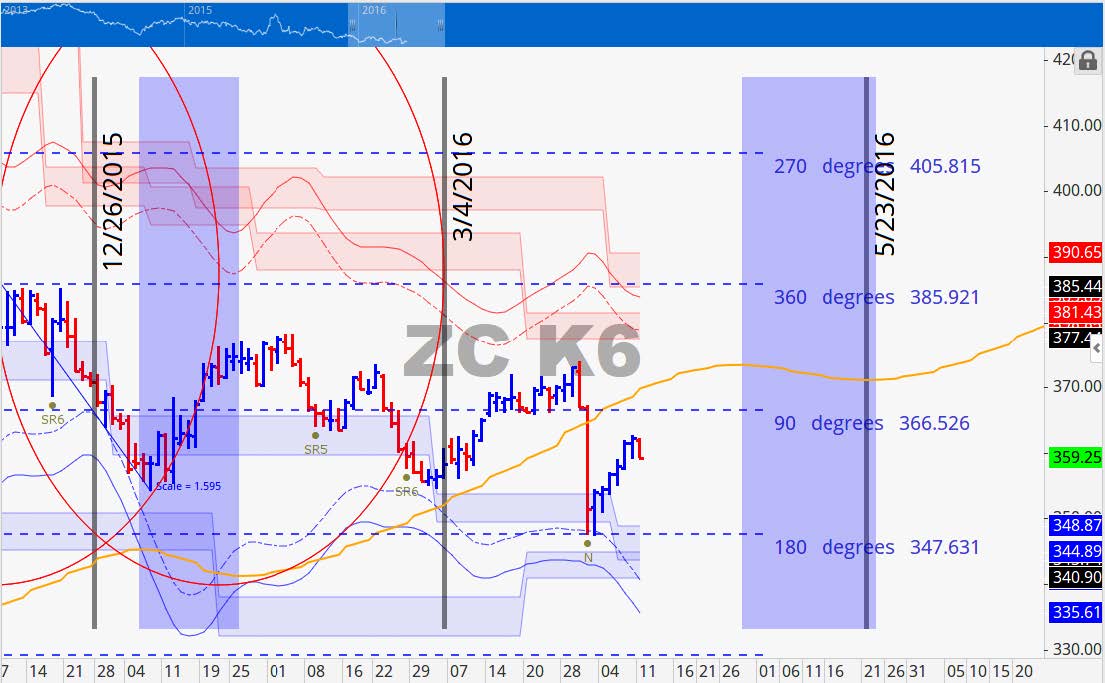
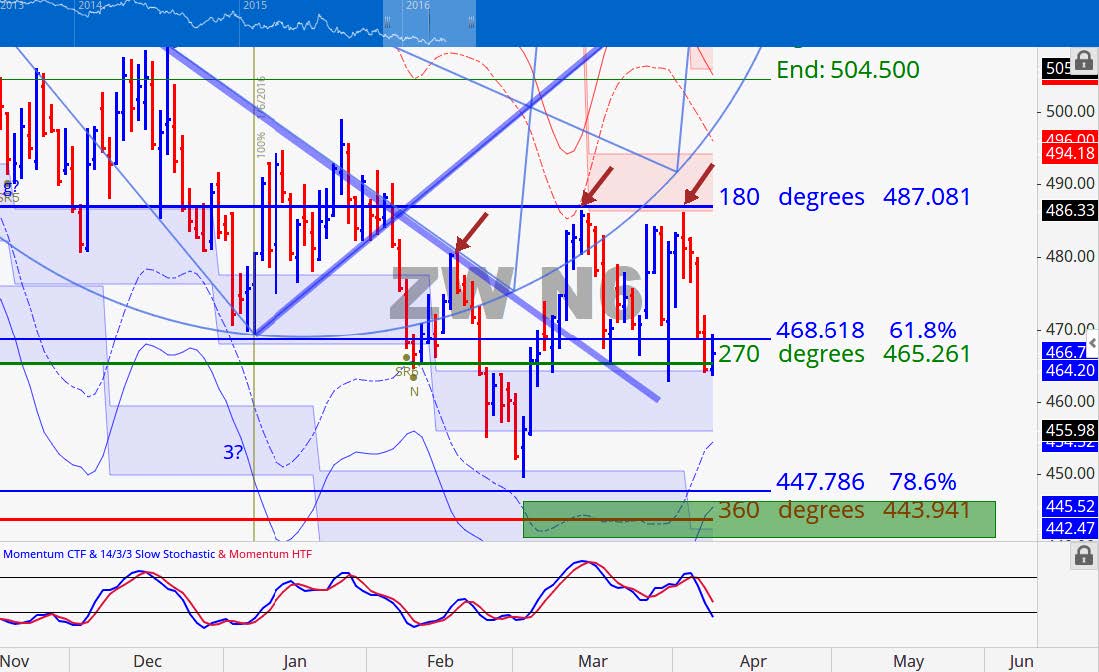
May Corn held support at our 180 degree mark of 347 ½ as anticipated. That support level was particularly strong because it coincided with an extreme volatility level. Overhead resistance is at 366 ½ and at 378 we have a volatility extreme price level of 378. Both of these extreme points should stand as strong support/resistance areas. When and if the market is able to break either side of those levels we would view that move as significant.
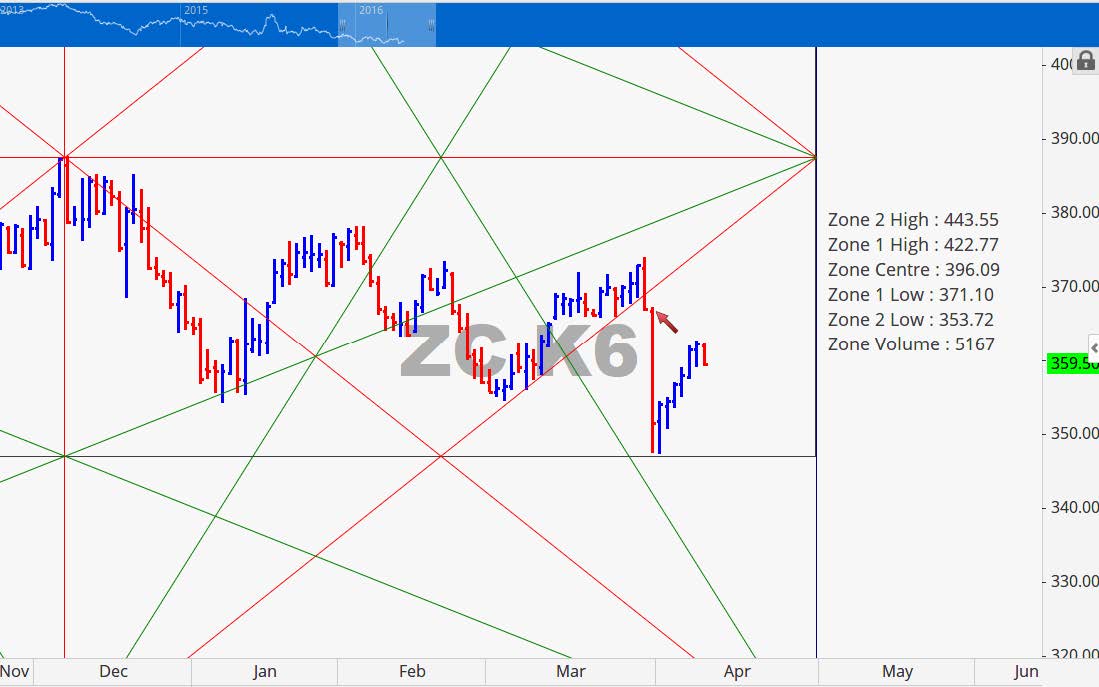
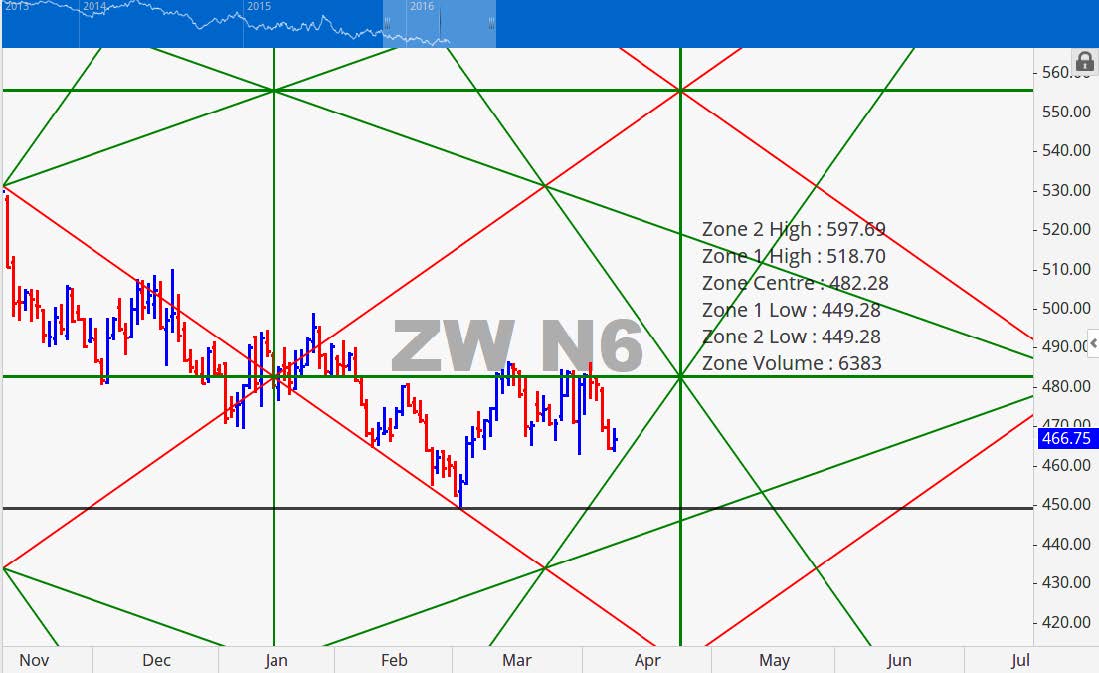
In the chart to the right, we have included our point of control level which is labelled at the Zone Centre. The two zones on either side of the point of control are 1 & 2 standard deviations away from the point of control. These levels will serves as projected support and resistance with the point of control standing as the strongest demarcation point. On March 31st (USDA report) when price broke down through 371, that was a tipping point one standard deviation below the point of control.
December 2016 Corn Charts
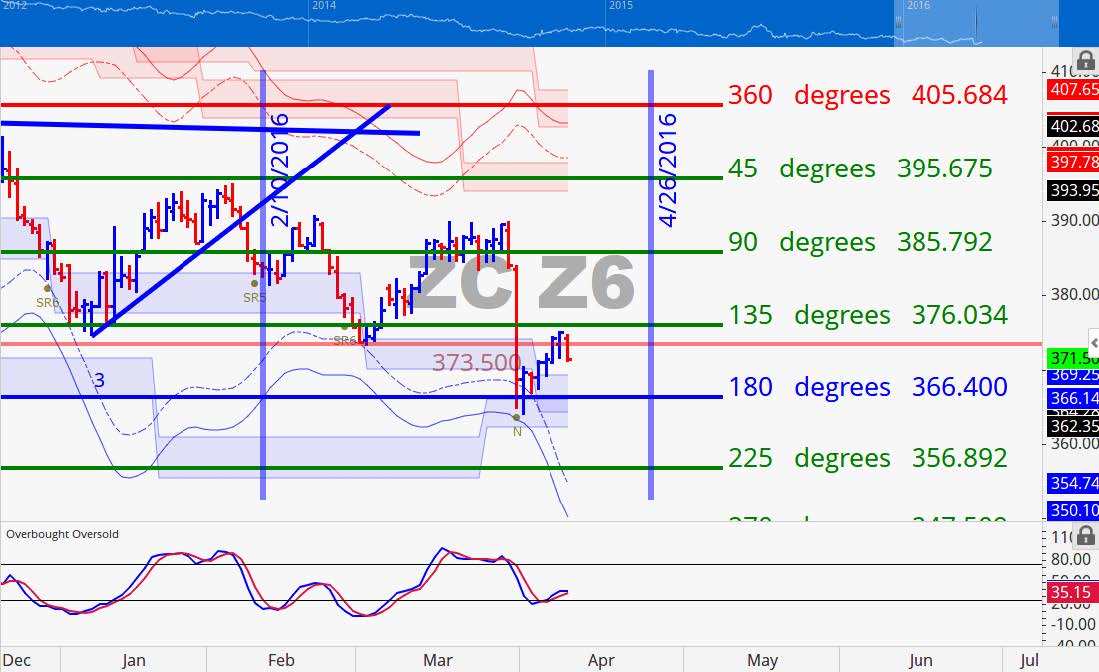
The December contract likewise found support at the 180 price level which was at 366 ¼. Price have since moved higher but is having a bit of intermediate trouble at the 135 degree mark. Instead of showing only the 90 levels we showed the 45 degree levels as well because the deferred contracts often do not move through the levels as rapidly. Breaking down below 366 should send prices to 256 ¾ at a minimum.
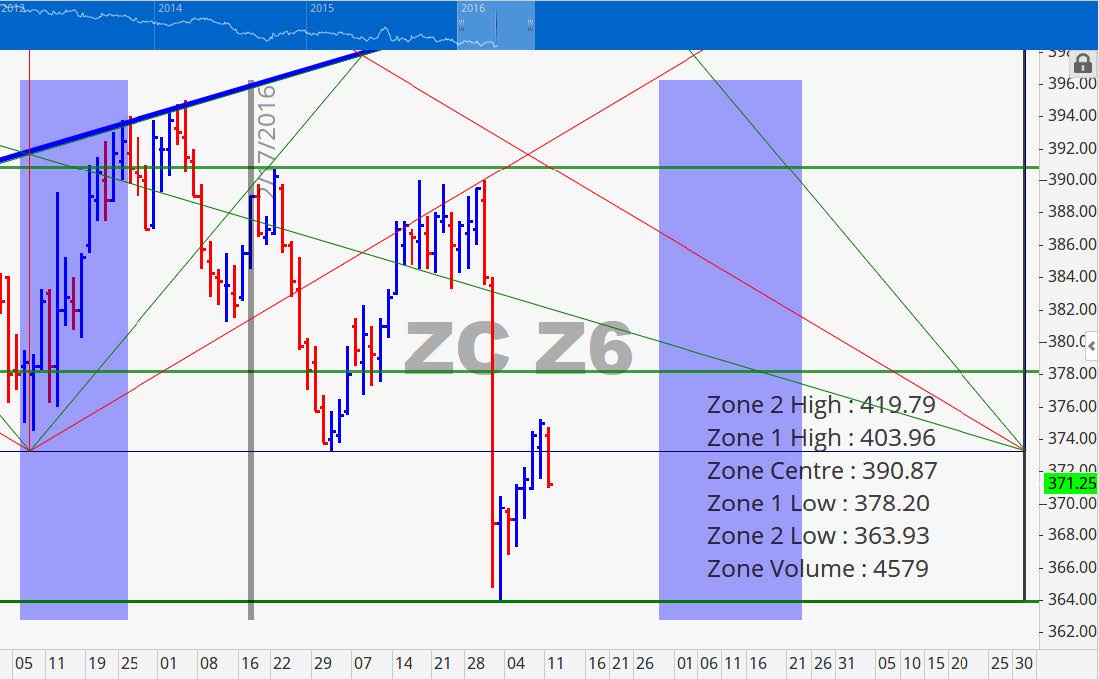
To the left, we have our point of control at 391. The corresponding levels on either side are 404 and 419 ¾ above with 378 and 364 below. The price retacement on the May contract was close to 61.8% but the retracement on the December contract was only about 43%. This suggests that the market believes that the deferred contract is weaker than the nearby. This is consistent with supply estimates.
Soybeans
Corn initially pulled Beans down at the onset of the USDA report release but it soon recovered and continued to find strength through the end of the week. Soybean stocks were released at 1.530 billion bushels (BB). The March Grain Stocks report was the 3rd largest stocks results on record. The other two years that were higher were 2006 and 2007. The Prospective Planting Report showed a decline in Soybean acres planted coming in at 82.2 million acres. The acres planted number appears to have carried higher weight than the grain stocks number which made for some bullish sentiment in the Soybean market. According to the Commitment of Traders (COT) report it is starting to look like managed money is turning a bit bullish. Long positions held by managed money has edged up to 18.3% of all long positions which accounts for the largest number in over a year. It was 19.9% in January of last year. Additionally, managed money holds 9.1% of total shorts which reflects a drop in their short position holding. We are seeing signs that managed money might be anticipating near term higher prices. May Beans rose 7 ¾ last week and November Beans advanced 9 ½ cents. Prices recently broke through resistance at 360 and 180 degree of price levels respectively as evidenced on their charts. If they stay above those levels this week prices could find some strength.
May 2016 Soybean Charts
We have been discussing the long consolidation pattern over the past few weeks. The last 3-5 trading days is starting to look like the makings of a resolution to the upside. Price move up to the 360 degree mark which is often a terminal level for market price action the first time it is tested. This is the third approach since October of last year. If the market does not fall back down here this price level could become strong support. May Beans is starting the week in a strong position. If it remains above 910 through Wednesday would look for a minimum price objective of 939 ¾.
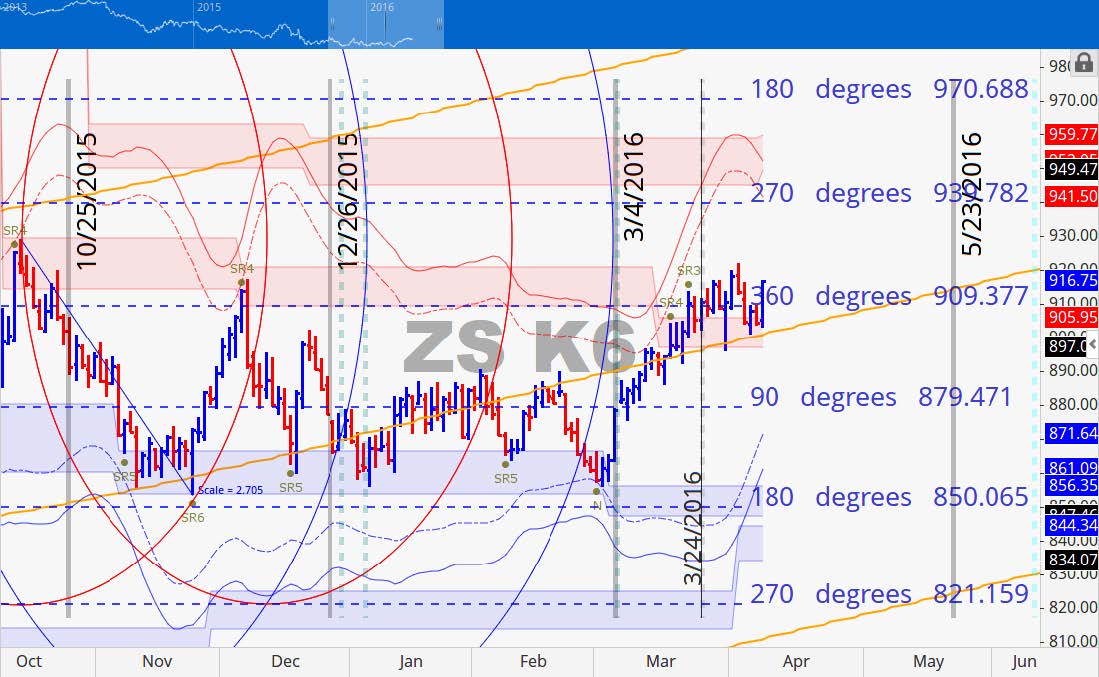
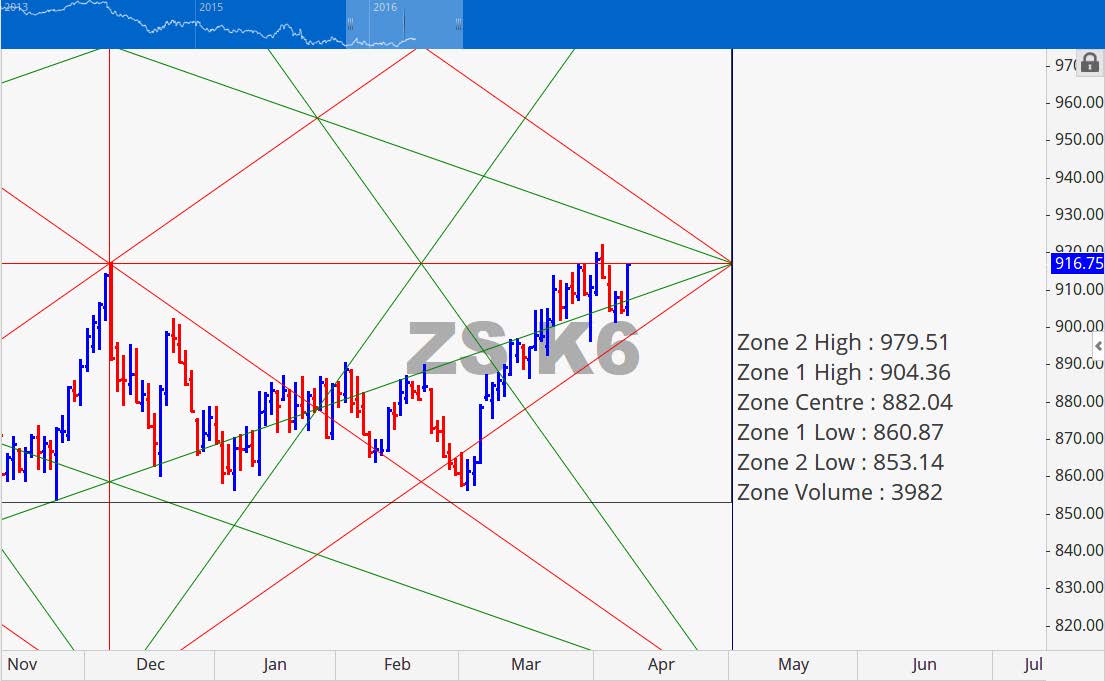
The chart at right shows the details of our point of control with it respective zones on either side of it. 904 ½ had been holding all of last week but the next area beyond it is 979 ½. The 1st line of resistance would be a 936 ¾ but if there is enough momentum we could very well see the zone 2 high price level reached.
November 2016 Soybean Charts
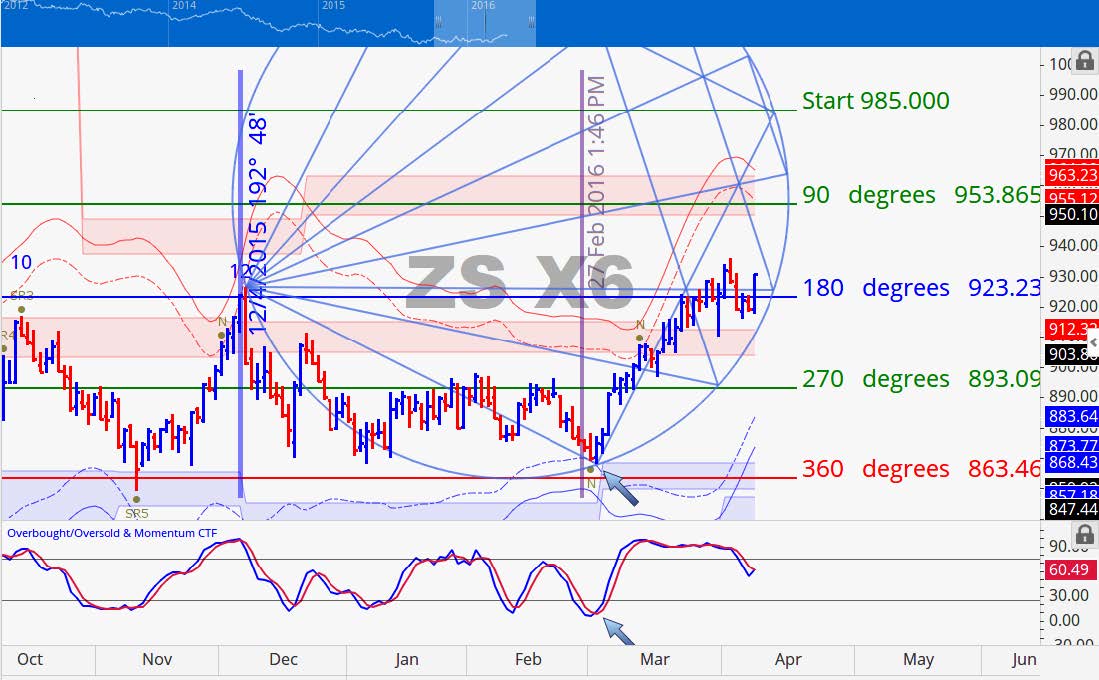
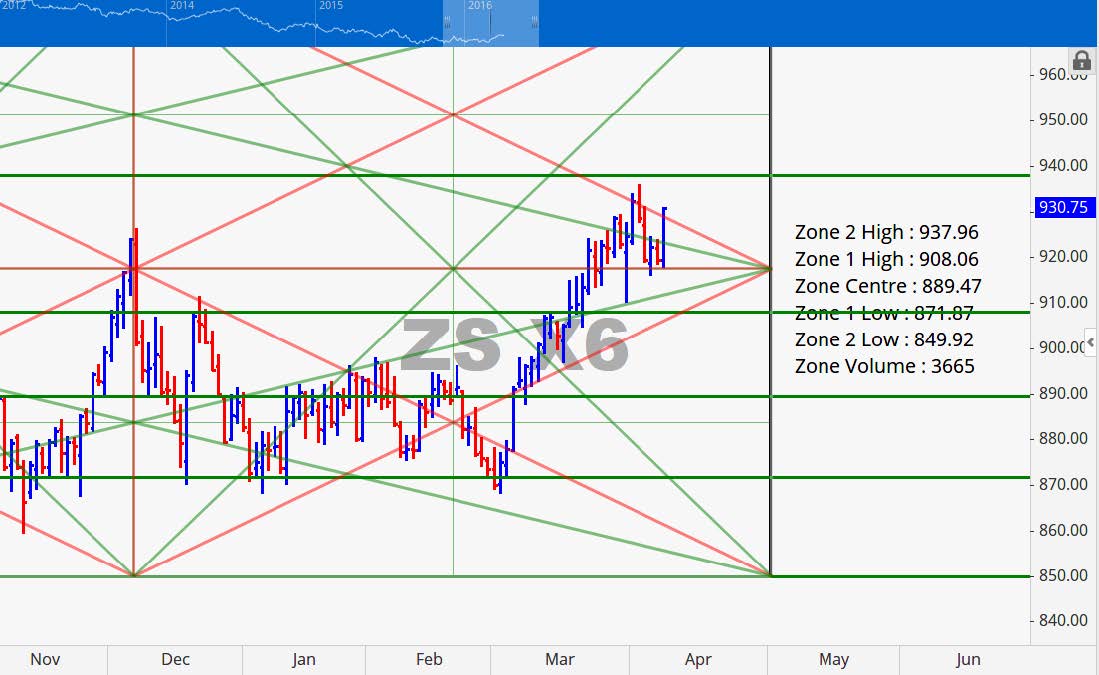
The November contract consolidated at the 180 degree mark 923 1/4. Price is above the neutral zone of volatility based support/resistance continued strength in the near term is possible. A move to the upside would be purely based on the technical charts and not the fundamental narrative. The price target of an up move would be 954.
Grain Market Overview October 11
Read more