
Grain Market Overview 2/17
February 17, 2016Grain Market Overview 2/24
February 24, 2016Commodity Market News 2/22

Summary
On Friday February 19th, Senator Pat Roberts (R-Kansas) introduced a federal bill that would set up a voluntary Genetically Modified Organisms (GMO)/Genetically Engineered (GE) food labeling system. For now the bill appears to be garnering the approval of the American Feed Industry Association (AFIA), the International Dairy Foods Association (IDFA) and the American Soybean Association (ASA). According to the proposal states would be prohibited from establishing their own GMO labeling laws. The rules would be developed by the USDA within two years of the bill’s ratification and would include an educational component that would “educate” consumers about the “safety” of AG biotech. For some customer advocacy groups this is perhaps a step in the right direction but the educational component may be perceived as an effort by biotech industry to drive the narrative. A genetically engineered food is a plant or meat product that has had its DNA artificially altered in a laboratory by genes from other plants, animals, viruses, or bacteria, in order to produce foreign compounds in that food. This type of genetic alteration is experimental. There have been no long-term studies conducted on the safety of genetically engineered foods on humans. The argument for sustainability is the primary rational offered by the biotech industry for moving forward without adequate long term testing. Currently 64 countries with over 40% of the world’s population already label genetically engineered foods, including the entire European Union. Even China labels genetically engineered foods.
Also announced on Friday, farming and construction equipment conglomerate John Deere announced that it expected equipment sales to fall 10%, down from a previous forecast of a 7% drop. It expects net income to total $1.3 billion, down from $1.4 billion in a previous forecast. Deere beat analysts' expectations of $0.71 a share for profits in its fiscal first quarter but at $1.12 a share profit were down 80% from the prior year. The farming industry has been feeling the pinch of shrinking incomes because oversupply had weakened prices. Samuel Allen, John Deere CEO, cited the downturn in the global farm economy along with weakness in the construction equipment market as factors in the 1st quarter results.
Saudi Arabia and Russia have proposed a tentative agreement to curb Crude Oil production but there has not been any traction with the other OPEC members. Iran has not committed to any production reductions and it is not likely that they will participate. The industry continues to suffer from massive oversupply as evidenced in the Baker Hughes rig count dropping to 413 last week, down from 1009 this time last year. March Crude was gained 20 cents on the week but it is coming off the board soon. The April contract lost 16 cents but that is a far cry from the weekly losses that Crude had been suffering. It does appear that Crude prices might be trying to stabilize. Corn, Wheat and Soybean futures all finished higher on the week. The US Dollar Index gain 66 points on the week.
Corn
March Corn rose 6.75 (1.88%) and the December contract 4.75 cents (1.24%). Export Sales for Corn were the 4th largest of the sales year at 1.057M tonnes, just topping the top end of trade expectations that ranged from 600k – 1M tonnes. Total commitments are at 61% of the USDA export total.
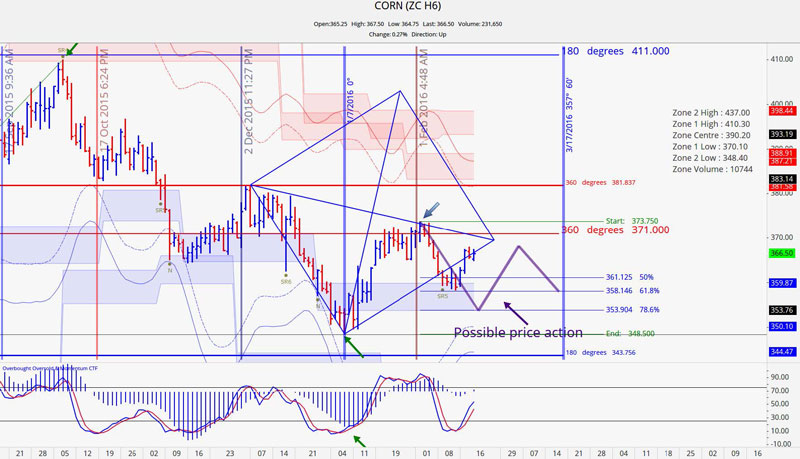
Corn may have put in a low about a week earlier than anticipated but the price pattern for the cycle could still hold. We are looking at a potential rise to resistance before heading back down again.
March 2016 Corn Charts
Corn Futures bounce from support at 358 and is making its way to resistance at the 371 to 373.50 range. We initially thought that prices might move down into the end of the month before rising to resistance but we are not surprised because we had confluence of support at the 358 range. Last week we were looking for a break of 353 to signal continued weakness. This week we are looking at a break of 375 to confirm potential strength.
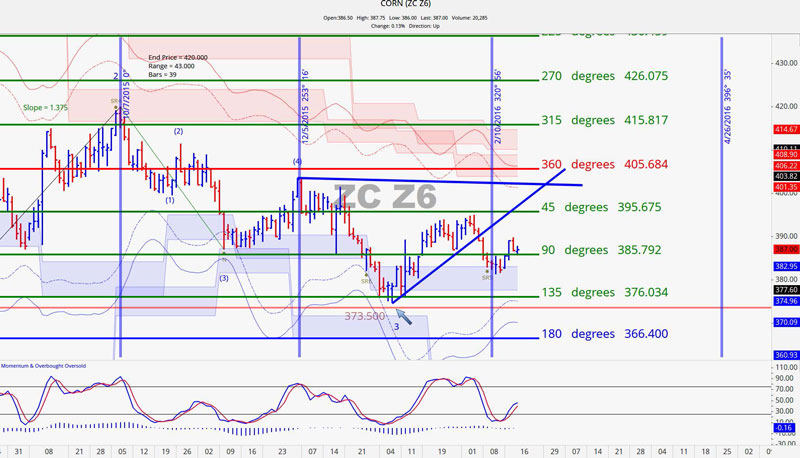
December 2016 Corn Charts
February 10th cycle low worked out perfectly for this contract. The market went from moving down to moving up. Overhead resistance rests at 395.75. Then we have a confluence of levels near the 405.75 level. We believe that prices are going to have a tough time getting past 406 on its 1st attempt. There is a number of factors that have led us to draw this conclusion. First, we have a 360 level there. Second, we have volatility based resistance there. And finally, one standard deviation away from the point of control is at 404.
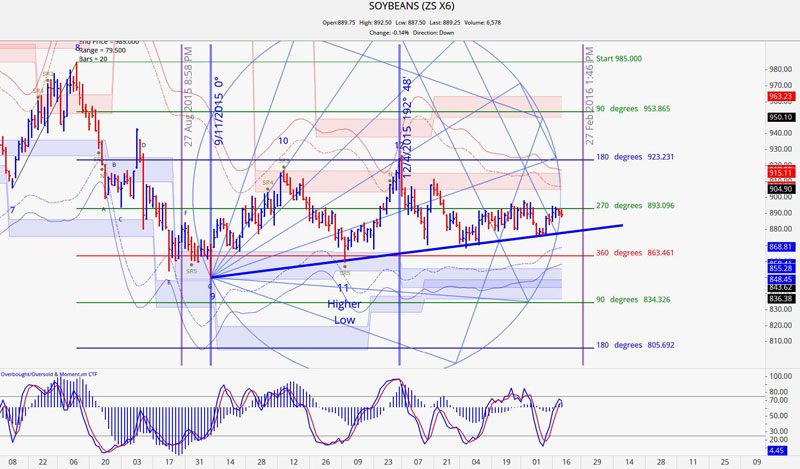
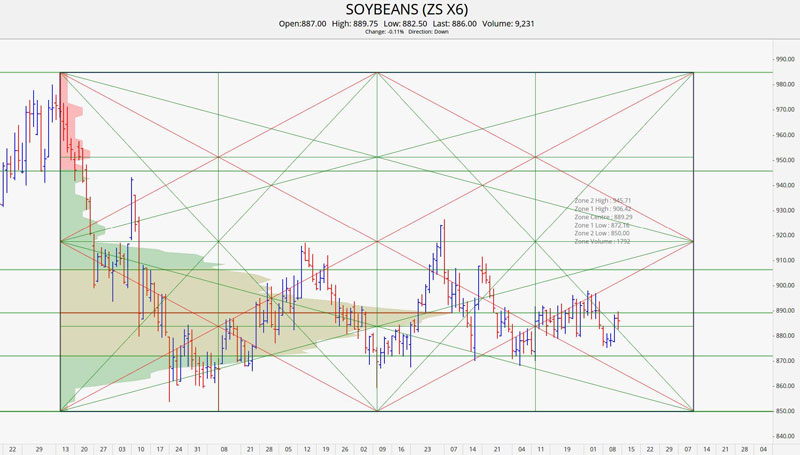
Soybeans
The Port of Paranagua is the second largest Soybean producing state in Brazil after Mato Grosso. Reports are coming in stating that the wait times at that port are about 60 days. Soybean export sales number were not very strong this week. Trade estimates ranged from 400k to 700k tonnes with the actual coming in at 567k tonnes. Soybean commitments were at 91% of the USDA export total.
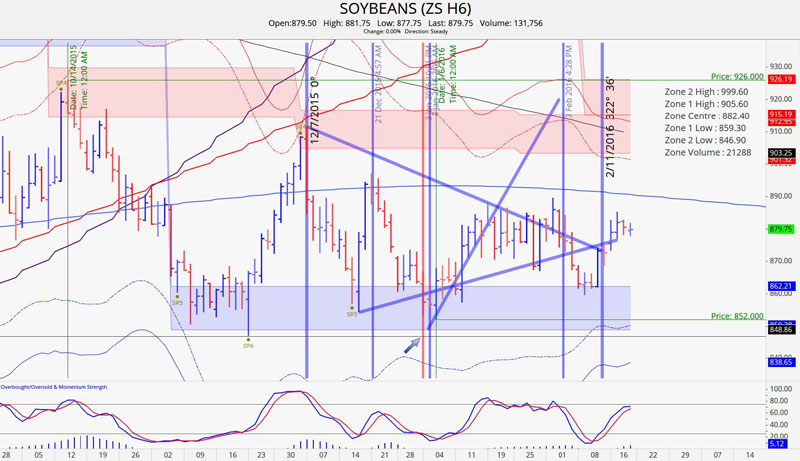
March Beans gained 5.50 (0.63%) cents last week and November Beans squeaked out a 2.40 (0.28%) rise. The volume has declined the past two weeks so it will be interesting to see if volume is able to return to the market space this week.
March 2016 Soybean Charts
The trading range for the week was even smaller than the previous week at 10 cents. It was a shortened week because of the Presidents’ Day holiday. The contract closed above 876 every day last week setting the weekly high at 885.25. It did not quite get to 890 but looks to do so this week. The contract is close to being overbought so it could make its way to 905 before finding strong resistance.
November 2016 Soybean Charts
The November Beans contract has reached the edge of the scaled geometric circle and the price action is hinting at a move that tests 905 once it is able to get past resistance at 893. The long drawn out tight trading range has had very low volatility. The point of control which sits at 889.75 has been functioning as an energy node with price oscillating around it. A small up move to resistance is looking more probable.
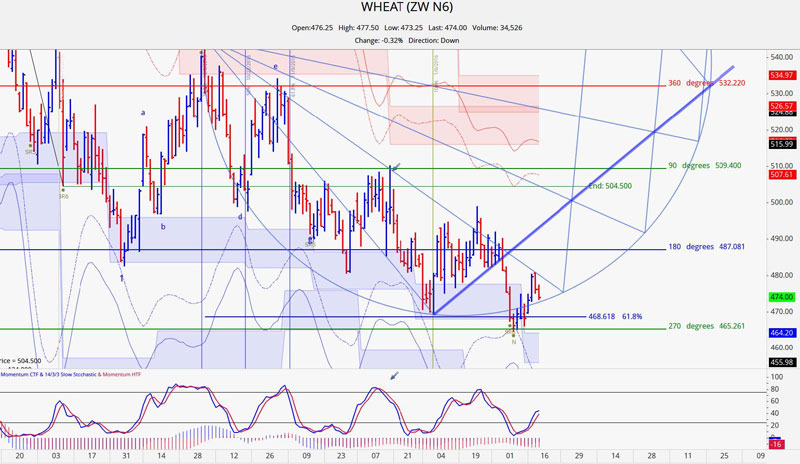
Wheat
The bearish sentiment has not changed for Wheat as evidenced in its export sales numbers. The trade was looking in the range of 200k to 400k tonnes. The actual came in at 253k tonnes. Total commitments were at 82% of the USDA export total.
France has an estimate 6 million tons of Wheat stocks which is the largest stockpile they have had in almost two decades. Egypt came out with a new written policy accepting .05% ergot fungus. Exporters have been reticent of transacting with Egypt. They are hoping this recent measure will reassure exporters to participate in tenders.
July 2016 Wheat Charts
The July Wheat contract is seven trading days removed from the low at 464.50. Wheat does not have much to stand on outside of the possibility of being pulled up with a technical bounce on the part of Corn and Soybean. A fade at 487 is a reasonable spot to test the waters on a short opportunity.
Crude Oil
Crude Oil closed out the week in grandiose fashion. On Friday it gapped higher and the March contract posted a gain that was 19 cents shy of $3.00. A meeting between Saudi Arabia and Venezuela about a week ago was not able to yield a production cut agreement which in turn sent prices tumbling all last week once again. By the end of the week the United Arab Emirates (UAE) energy minister said that some members of OPEC were ready to cooperate on possible production cuts which made for the big rally on Friday.
March 2016 Crude Oil
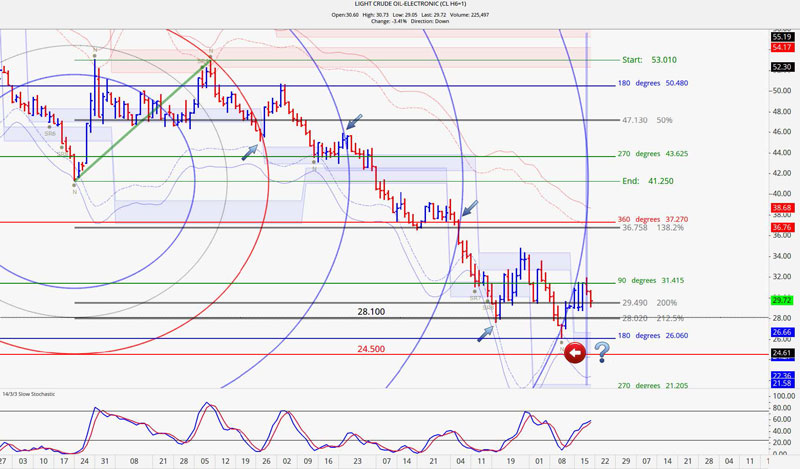
This will be our final look at the March contract as we are moving to the April contract. The edge of the harmonic circle coincided with a market pivot. It does not come as a surprise since these series of harmonic circles have done a remarkable job of pinpointing possible turning points.
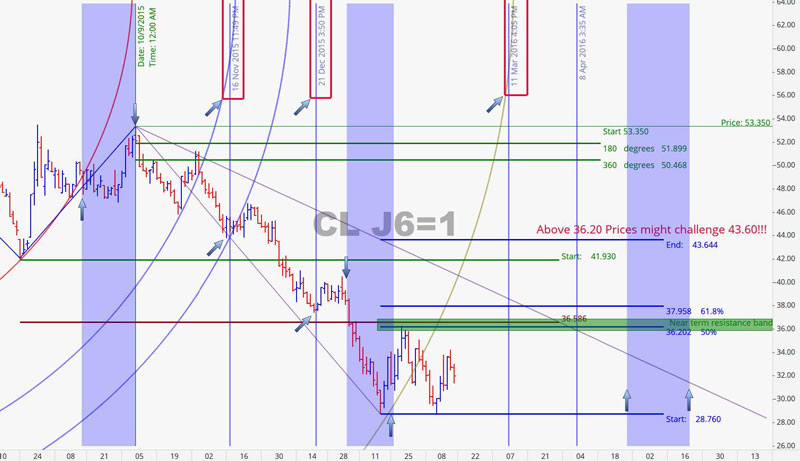
The April contract has key resistance at the 36.20 to 36.30 price band. A break of 36.30 prior to breaking the contract low of 28.76 made on January 20th could make for a run that gets to 43.60 very quickly. We also have March 11th as a cycle date to keep on your radar for a possible trend change indication.
Grain Market Overview October 11
Read more