
Grain Market Overview 2/10
February 10, 2016Grain Market Overview 2/17
February 17, 2016Commodity Market News 2/15

Summary
Chinese markets were closed last week for their New Year’s celebrations which fell on February 8 this year. El Nino is not fading away as quickly as originally anticipated with readings from last week actually coming in warmer. Russia has elected to ban US Corn and Soybean imports indicating that shipments have often been contaminated with fungus or other infections. Even with a record number of insured acres, crop insurance payouts were the lowest recorded since 2010.
After showing weakness the previous week the grain markets were choppy last week. As more fundamental data surfaces in the weeks ahead market direction will become clearer. Buyer interest has been limited by a lack of fresh supportive news. Instead traders are consistently reminded of the situation of too much supply in the face of a lack of demand. The current macro-economic environment is keeping grain and commodity buyers on the sidelines. The USDA's February Supply & Demand Report continues to reinforce that notion that there's too much supply and not enough demand for the Corn, Soybean and Wheat markets.
Historically, price advances that occur during this time of the year are a result of bullish export data. We are simply not in that type of environment at this time. In the short term the best thing that producers can hope for is some type of news event that causes traders and speculators to cover short positions that in turn creates a low of significance. It is not likely that the desired bullish news will come from export demand. Last week, the USDA lowered its 2015-16 Corn and Wheat export projections while leaving the Soybean export projection unchanged.
The US Dollar index has had a rough go the past two weeks. It’s lost 3.503 points (3.52%) in the month of February. Last week we shared that the key price level for the US Dollar index was 95.50. A close below that level would potentially be a precursor to a move that reaches the 94.45 to 93 area. The USD traded through that key level but the low close was 95.562. If the USD returns to weakness this week and gets below our key level, that could be the needed news item that helps the US grain markets find some legs. For now, end users have no interest in booking prices as long as they feel that prices are headed lower.
Corn
Corn futures declined ahead of and post the USDA’s WASDE reports last week. March Corn lost 7.00 cents (19.1%) and the December contract lost 7.50 cents (1.93%). Drought stricken areas of South Africa were the recipient of much needed rain. The beneficial rains have allowed officials to reduce their Corn import projections by 1/3 down to 4 million tons. Corn production for China is projected to increase 10 million tons versus last year to 225 million tons for the 2015-16 crop.
Thirty years ago the Corn market had a similar period of oversupply and lack of demand. If this cycle repeats we are looking at a possible decline through the end of the month/early March followed by a bounce in March. We would then be looking at a decline that starts during the spring planting season that persists into the early summer.
March 2016 Corn Charts
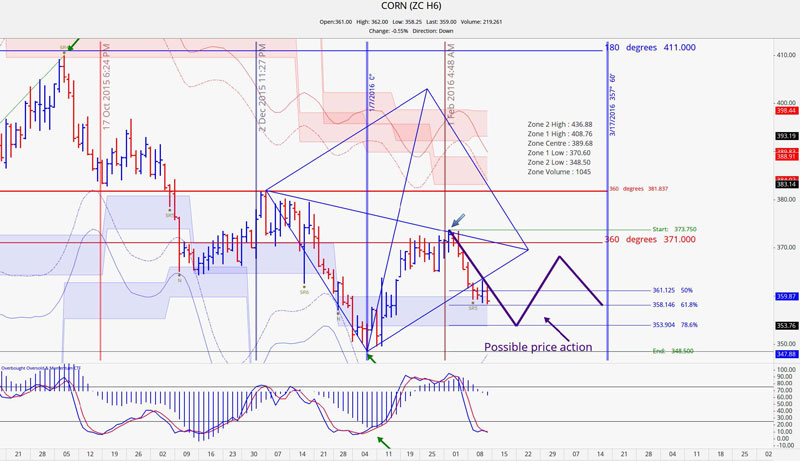
Last week we traced out what we thought might be a possible outcome for Corn futures price action in the coming weeks. The recent decline is in line with expectations and we will continue to monitor its progress. The latter part of the week, prices consolidated near the 61.8 retracement level of 358. The significant technical hurdle we are watching for is how the futures will respond to the 353 ¾ level if prices get there. Past 353 a test of 348 is highly probable.
December 2016 Corn Charts
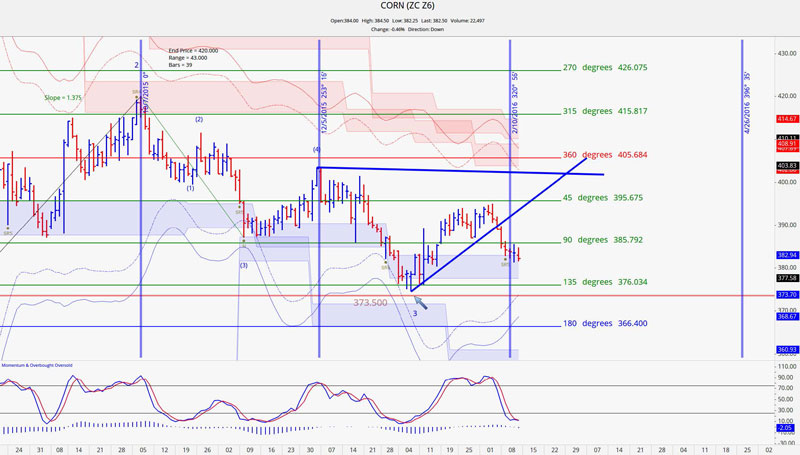
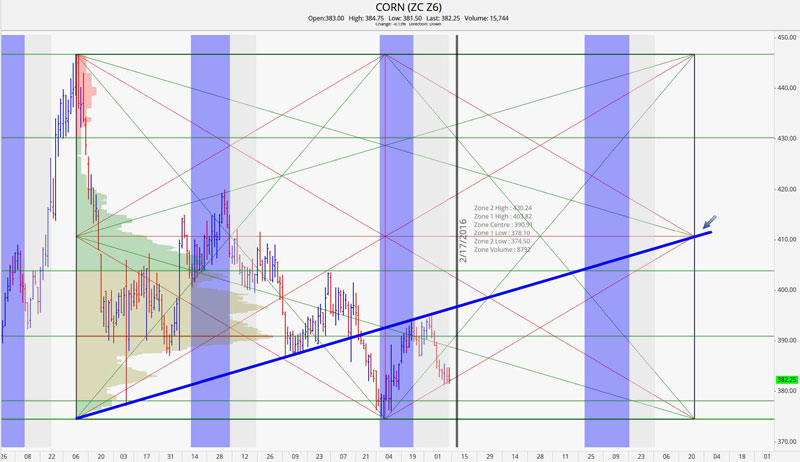
In our last newsletter we spun out some cycle dates that pointed to February 10th as a potential turn date. The projected turn date can be viewed as successful is the market changes direction or trend within a day or two of the date. In this case, the price action was moving down going into the turn date and market turn from moving down to sideways.
You will also notice that prices came up to our 1 x 2 angle then rolled over only to consolidate along the upward sloping red trend line projected from the contract low. Our downside support level of 377 ¾ held up very well. Multiple techniques (red trend line angle, 1 standard dev. below the point of control & volatility support) came together at that support level. Breaking through this area should be viewed as significant.
Soybeans
After a wet winter and early spring, the rain stopped in Argentina and great concern was the early planted Soybeans. Those concerns were alleviated when timely and beneficial rains fell across the majority of Argentina which in turn reduced their weather risk. The WASDE report adjustments were only minor. US Soybean ending stocks for 2015-16 were projected at 450 MB, which was a 10 MB increase from last month projections due to a lower crush.
The cycle for Soybean is the 10 year cycle and like Corn is pointing to a decline into the summer months because of the large supply that we are seeing. We anticipate that prices will be choppy until the start of the planting season at which point a decline into summer should begin. Near term November Bean prices will probably struggle to get past the 900 to 915 mark. If prices venture anywhere near there it would probably be in the interest of producers to at least lock in some pricing there.
March 2016 Soybean Charts
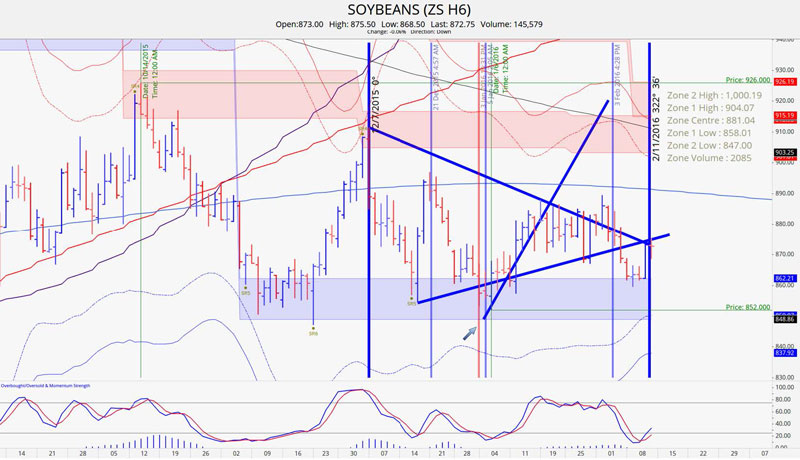
The trading range for last week was 859.50 to 875.50. We thought that the price action would rest inside of 885 to 881 that is exactly what happened. Volatility based support at 862 held as we noticed that the low close for the week was 862.25. A close below 862 this week should send us down to support at 848.75. A close above 876 on Tuesday could make for a test of 890 by the end of the week.
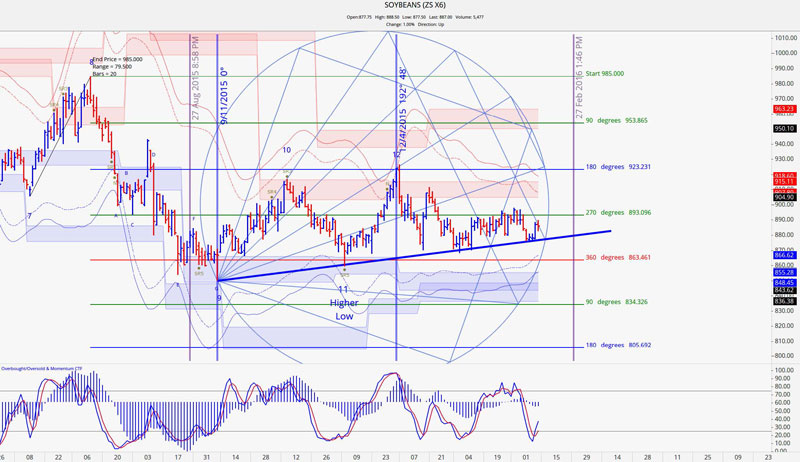
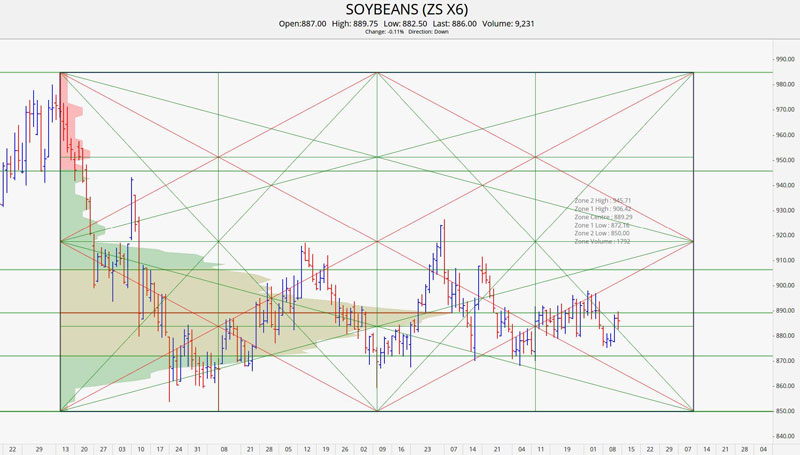
November 2016 Soybean Charts
The November Beans contract touched our geometric trend line for the third time last week. Thursday was a big day but was primarily the result of rumors that led to some profit taking. There was no real follow through on Friday and the market will be close today for the President’s day holiday. The daily trading range for the November contract continues to be tight and evenly paced. We are looking for prices to find difficulty breaking outside of the 905 to 906.50 range in the coming weeks. The high of the week came in at 889.75 the point of control was at 889.25.
Wheat
Bunge is suing Egypt’s GASC over cargo of French Wheat that was rejected in December due to ergot fungus. On Monday February 9th, Bunge Ltd. said that it began legal proceedings against the Egyptian government over a cargo of grain that was recently rejected, escalating a standoff between the world's largest Wheat importer and its suppliers.
Amidst the controversy, Egypt’s tender for Wheat on Monday, February 9th received no offers do uncertainty about quality restrictions that disrupted the delivery process. They later issued statements of clarification and reissued a tender and purchased one cargo of Romanian Wheat. They issued another tender on Friday afternoon.
Wheat export sales were right in line with expectations. The trade was calling for 100k to 250k with the actual number coming in at 189.4k. The WASDE report held only one change for the wheat balance sheet. Exports were lowered by 25 million bushels.
July 2016 Wheat Charts
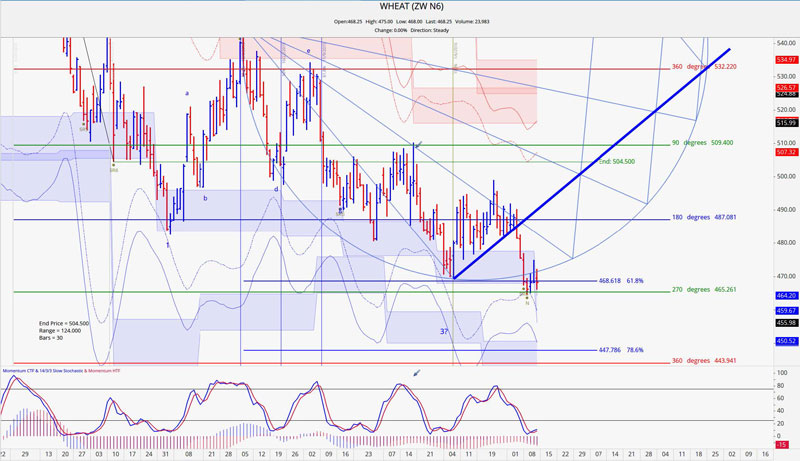
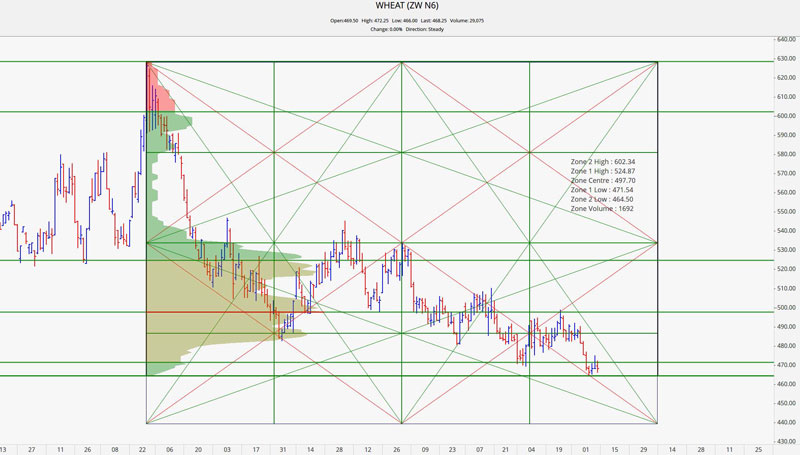
The July Wheat contract did breach and close below the 469 ½ low made on January 7th. It made a low of 464.50 on Tuesday then rallied for two days then returned to weakness on Friday. The decline from February 4th to the 9th was pretty strong. So it would not be out of the ordinary for prices to consolidate a bit this week (especially given a 4-day week). Our 465 minimum price objective proved to be good support but we are not seeing any fundamental data that would suggest any substantial price stability as of yet.
Crude Oil
Crude Oil closed out the week in grandiose fashion. On Friday it gapped higher and the March contract posted a gain that was 19 cent shy of $3.00. A meeting between Saudi Arabia and Venezuela about a week ago was not able to yield a production cut agreement which in turn sent prices tumbling all last week once again. By the end of the week the United Arab Emirates (UAE) energy minister said that some members of OPEC were ready to cooperate on possible production cuts which made for the big rally on Friday.
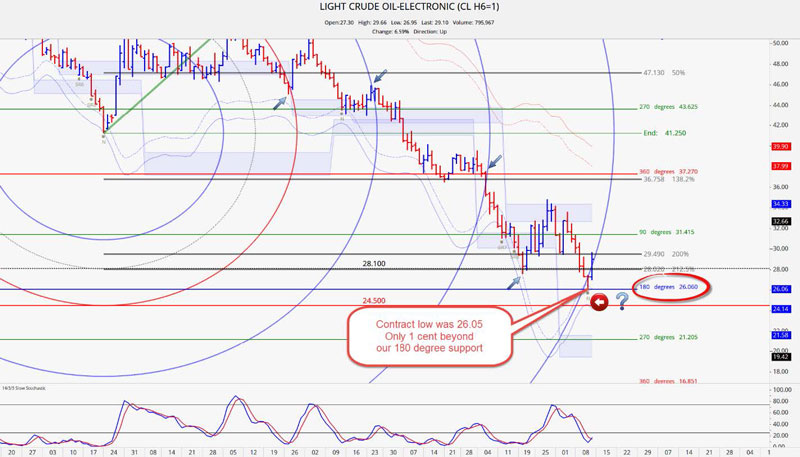
March 2016 Crude Oil
Goldman Sachs warned that Crude could slip to below $20 a barrel but it has been our stance that Crude may not trade much lower than 24.50. We would also like to point out that we had 26.06 as a key 180 degree support level for the March contract. The low of the week came in at 26.05! The low on Thursday was also timely in that it touched our harmonic timing circle and the volatility end band. We believe this points to serious significance with regard to the low made on Thursday. A minimum price objective move to 32.06/32.07 could very well be under way with the possibility of reaching 37.25.
Grain Market Overview October 11
Read more