
Grain Market Overview Jan 13
January 13, 2016Grain Market Overview 1/20
January 20, 2016Commodity Market News Jan 18

Summary
During the Asian Financial Crisis (more affectionately known as the Asian Contagion), the Dow Jones Shanghai Index lost 419.85 points (71.17%) over the course of 41 weeks. Over the last 30 weeks the same index has surrendered about 329.08 (45.95%) and is very close to breaking the lows made the week of August 24th last year. If the global landscape is not able to find confidence in China’s efforts to stave off this potential meltdown, breaking the August lows could set the stage for Asian Contagion Part 2. The news wires are suggesting that the Shanghai Index is just now entering a bear market position because it is just now breaching down 20% from the December high. The high in December was still 30% away from the June 2015 high.
Global stocks have been tumbling since the beginning of the New Year and money is flowing into government treasuries seeking a safe-haven. The US 10 Year Treasury is very close to October high and is sending interests closer to historic lows. The way futures are moving as of late suggests that ideas of a second Fed rate hike by its April meeting may be pushed much later. The reality is that the weakening economic outlook probably could not bear it and perhaps things are not as rosy as the most recent State of the Union suggested. The struggling Chinese economy has negative implications for the global economy. It is currently the mantra of Wall Street that a struggling economy leads to less demand for Crude Oil and other Commodities.
We remain bearish the grain markets overall but that does not mean we won’t see any short term bounces off support. It would take a major weather event and a weaker dollar to justify a bullish case. As it stands speculative capital hold very large short positions in the agricultural markets. A technical bounce to the upside could cause some short covering on the part of weak hands that frown on giving up some of their gains.
Corn
After finishing the last week down marginally, last week’s reversal bar finish on the weekly chart produce a net positive gain for Corn Futures this week. The USDA reports were less bearish than anticipated but it remains to be seen if futures prices will be able to advance against the backdrop of outside markets collapsing around it.
The Mato Grosso Institute of Agricultural Economics (IMEA) has reduced their estimate of the 2015-16 Safrinha Corn crop. The IMEA is estimating that 3.38 million hectares will be planted in 2015-16. That is a 2% increase from the previous year’s planting figure of 3.30 million hectares. Delayed planting and harvesting of the Soybean crop is expected to cause a delay in the Corn planting.
Hope Argentine Corn harvest received an uplift after the Buenos Aires grains exchange upgraded its sowings forecast for the 2nd time since December 17th. The rain that arrived at late in the planting season was enough to boost expectations. Argentina is the third-ranked corn producer after the US and Brazil.
Soybeans
Soybean Futures finished the week in positive territory but was well off the 892.25 that it posted on Thursday. In fact Friday’s move accounts for the loss of positive momentum that it had post the USDA reports. The bullish sentiment that Soybean enjoyed Tuesday through Thursday was largely forgotten on Friday. All things considered, Beans held up the best in comparison to Corn and Wheat. Producers in part of Southern Brazil are concerned about high levels of Soybean rust infestation in their fields. If the issue is not able to be contained and becomes wide spread the problem could translate into futures price support for the US. Brazilian scientists are estimating that if the fungicide used to control the disease is less than 85% effective, producers will actually lose money by way of a combination of lower yields and higher costs.
Wheat
Wheat futures finished the week in positive territory for the 1st time in a month last week but there would be no follow up this week. Wheat futures faded the USDA report on Wednesday then proceeded to rally and close the day on Tuesday near the high water mark of the day. That would be it for wheat in terms of market strength. The next three days were not as strong. On Friday it managed to post a small gain on the day but not before making a lower low and lower high on the daily chart. There are not any reports of weather conditions that would adversely affect any of the Wheat growing regions. Meanwhile the US and European Wheat futures markets are under heavy pressure. Earlier in the week high global supply levels pushed Paris Wheat futures to record lows. Also, wire reports this week say Kazakhstan, a key grain and Wheat producer in central Asia will export more grain this year.
Crude Oil
Crude oil was down nearly 6% during intraday price action Friday. Traders fear that Iranian sanctions may be lifted as early as today, adding to the current oil glut.
According to a recent Reuters newswire, the Russian Economy Ministry changed its 2016 forecast to predict an economic contraction rather than slight growth and has lowered its average oil price assumption to $40 per barrel. Two senior Russian governmental officials involved in budget discussions confirmed the authenticity of the document that was drafted last month. Russia is being forced to revise its economic assumptions as a result. Crude Oil is now below the benchmark $30 per barrel level which is well below the $50 per barrel that had been estimated for government planning.
It bears to mention that the US conveniently lifted its 40 year ban on Crude Oil exports. Saudi Arabia, a key US ally, has turned up production. OPEC in turn will not be outdone and that does not include Iranian product potentially coming to market. Looks like December 1998 all over again.
Our research suggests that it is market cycles that cause events like this to occur. So if you do the math, 2016 is about 18 years removed from when the Russian economy was derailed in this fashion. Go back 18 years from there and you will find that the US initiated putting pressure on the Soviet Union under the Reagan administration’s massive defense build-up, which raised defense spending from $134 billion in 1980 to $253 billion in 1989. Funny how these cycles just keep repeating but that is the subject of a much deeper conversation.
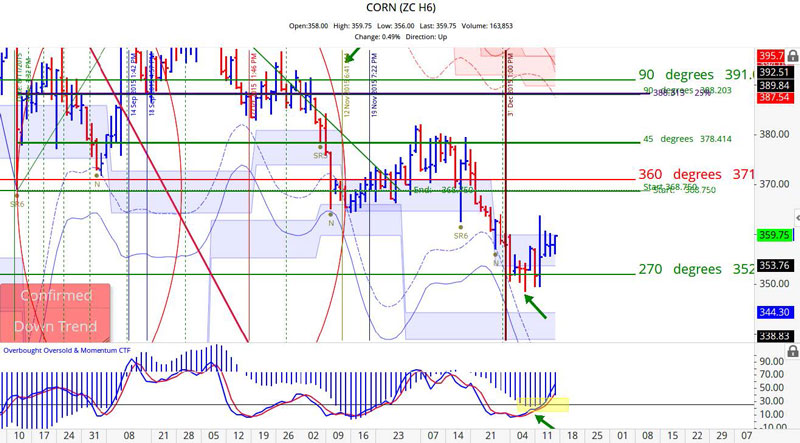
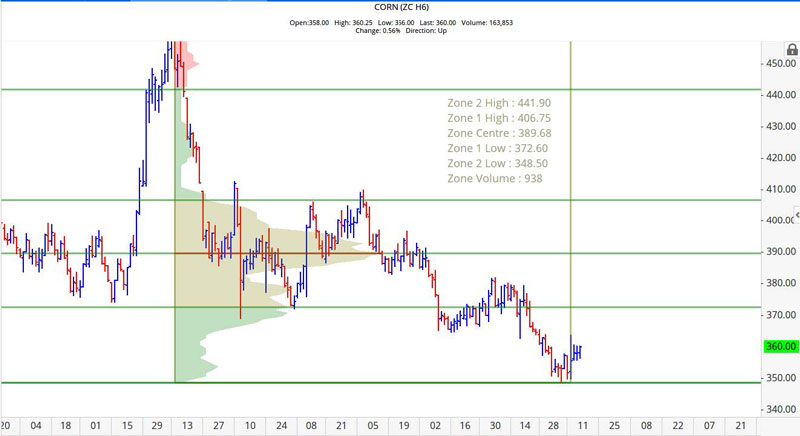
March 2016 Corn
Our cycle turn date foreshadowed the downtrend turning into a sideways market that continues to operate. March Corn moved sideways to slightly up last week and fund managers perhaps covered some of their short positions ahead of the long weekend. The price action last week does not come as a surprise. Price held the support level of 350 and above 360 price could make a run to about 370. Currently the price level of 372.50 is one standard deviation below the 389.75 point of control. We anticipate significant resistance around 370 to 375 the first time that price tests that area.
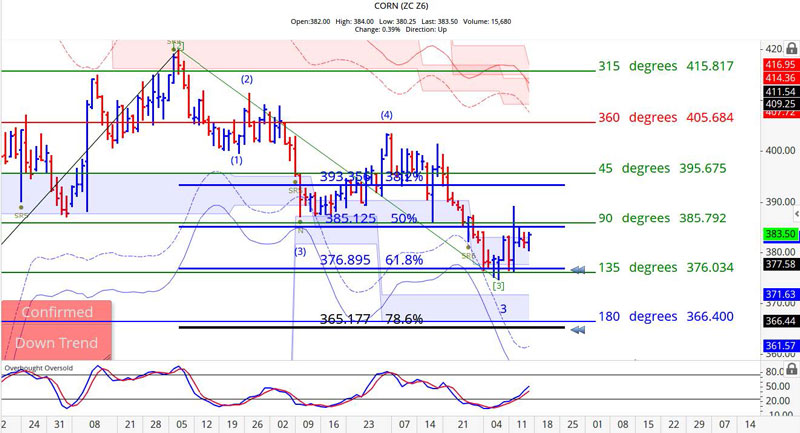
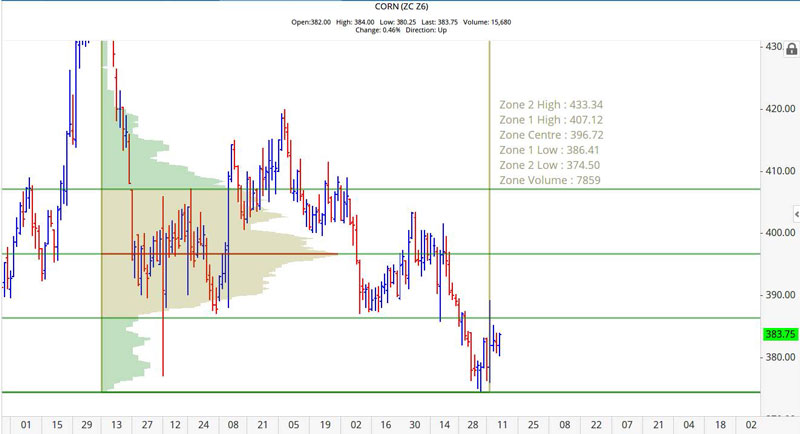
December 2016 Corn
December Corn found strong resistance near 386. There were several factors that came together to form confluence near the 386 resistance mark. Taking 50% of prior major swing points to 385.50. A 90 degree move from a prior high lands at 385.75, and one standard deviation from the 396.75 point of control rests at 386.50. SO even though there was an initial USDA report push above that level, the first time up was met with stiff resistance. This week if prices are able to get above 386 then we could see price channel between 396 and 386 for the duration of the shortened trading week..
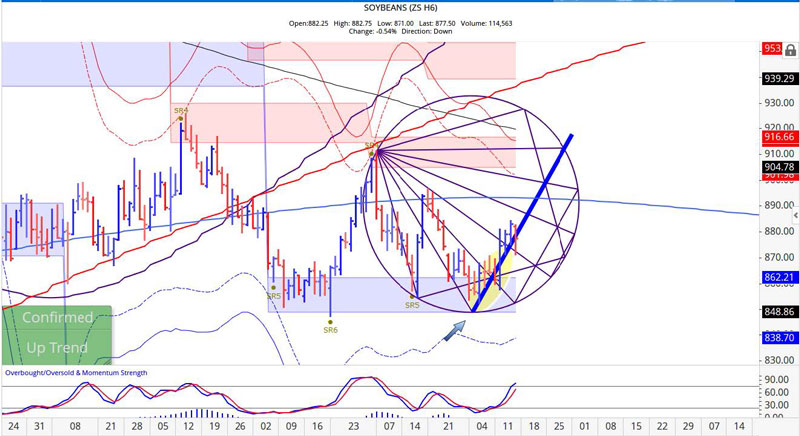
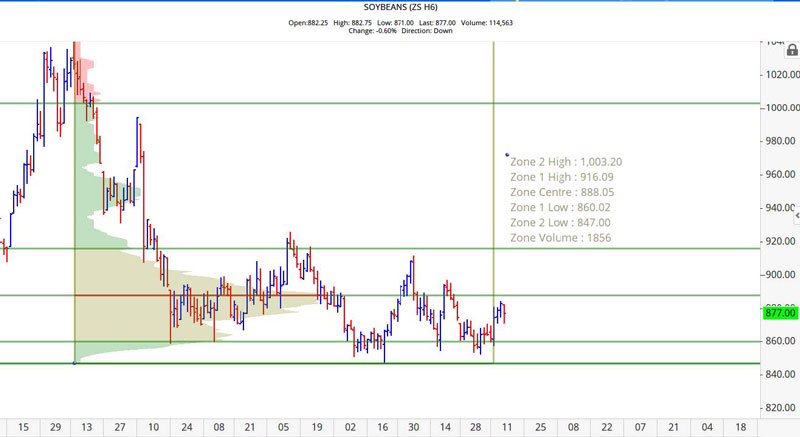
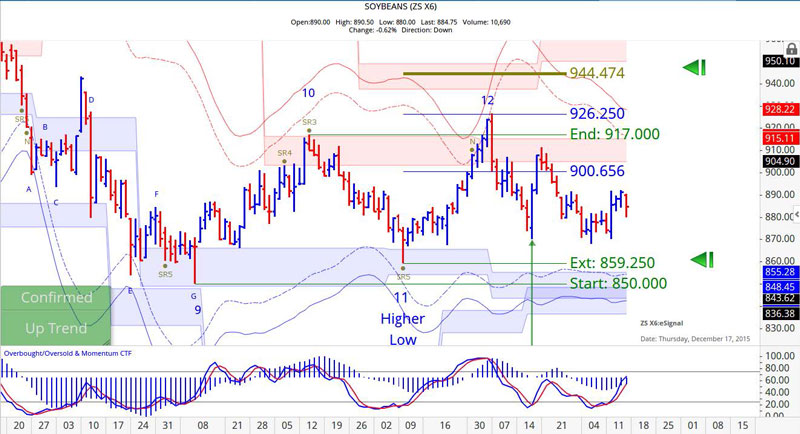
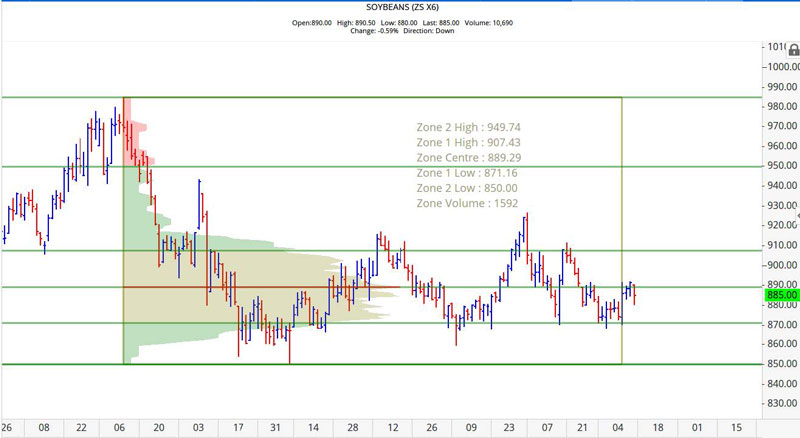
November 2016 Soybean
November Beans once held the 870 level all week. We now have a pseudo double bottom and move to past 900.75 would be an indication that this contract could get some legs under it. It has been 17 trading days from the December 21st high and 20 trading days beyond when prices touched volatility based resistance suggests that the market could get stronger if it fails to reach support. The high of the week was 892. The point of control was at 889.25 so we are not surprised that price failed there last week.
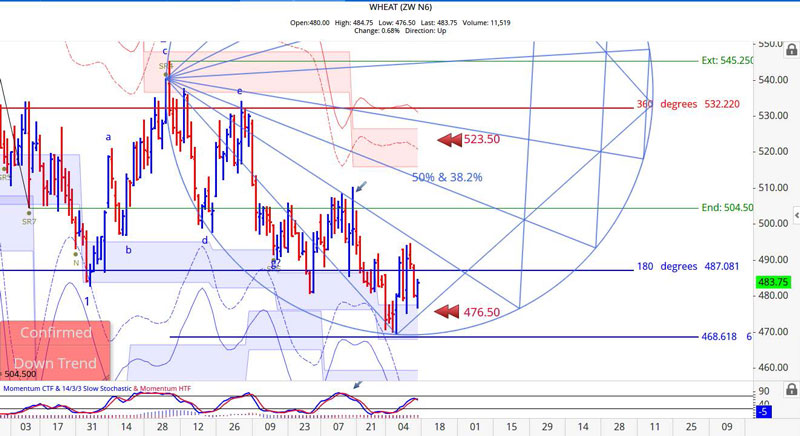
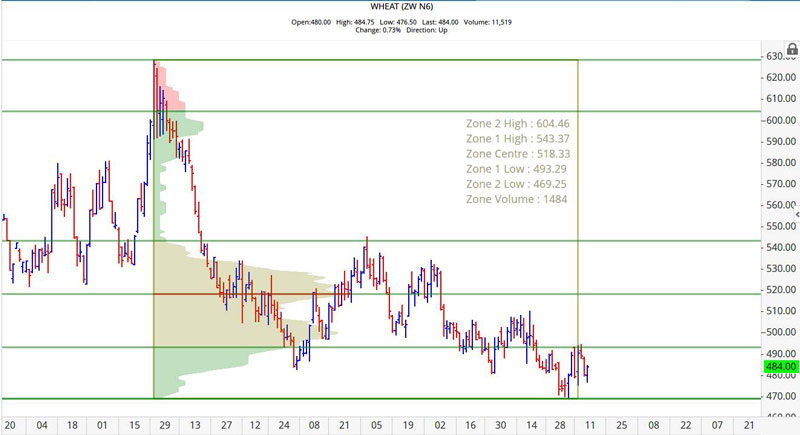
July 2016 Wheat
We established a new geometric structure for the July Wheat contract. The price action moved outside of the scope of the previous structure. The two price levels to watch for this contract this week are 477.50 and 487. We anticipate continued strength above 487 and weakness below 477. All week long the contract could not get through the 493.25 level which was one standard deviation from the 518.25 point of control. That behavior confirms that there continues to be lot of sellers at that level and it will need to trade through it where its next challenge will be the point of control.
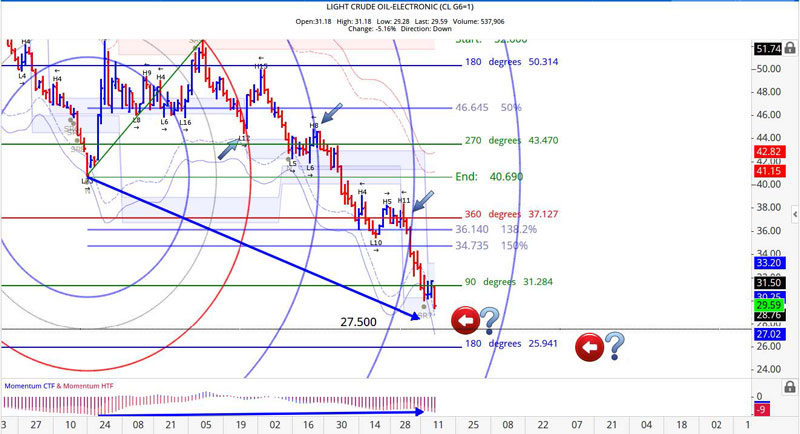
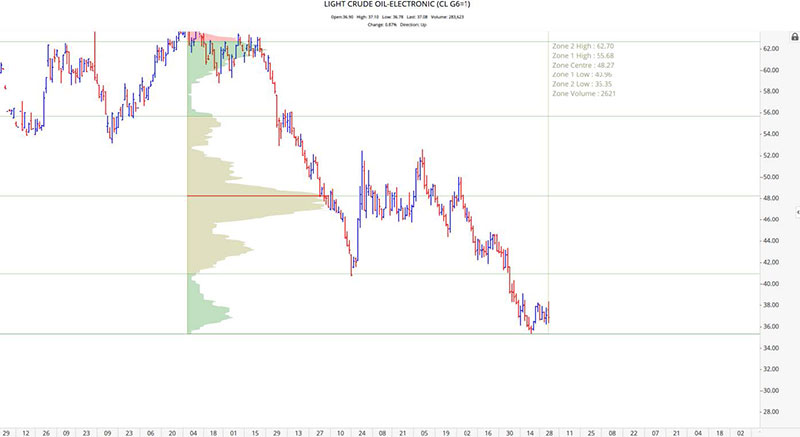
February 2016 Crude Oil
We introduced a price level of 27.50 last week for this contract believing the support should occur in the area of 26.50 and 27.50. As mentioned in our last newsletter, the pundits are calling for $20 or $10 for Crude Oil prices. When everyone believes that prices are headed in a certain direction that is when it does not happen. If prices are to hold inside of the aforementioned support zone a short covering rally could happen and do so really fast.
Grain Market Overview October 11
Read more