
Grain Market Technical Overview Dec 23
December 23, 2015
Commodity Market News Jan 5
January 5, 2016Commodity Market News Dec 29

Summary
There is one more trading week remaining for 2015 and like last week it will also be a short week. Most traders have taken both last week and this week off so the markets stand to be fairly quiet in trading.
The Argentinean peso devaluation translate into existing Argentinean Soybeans being less expensive when they enter the international market for sale. On the other side of the economic scale, the fertilizer, pesticides and farm equipment which Argentinean farmers need to import will be much more expensive. We believe that this will cause Argentinean farmers to plant fewer acres in the upcoming season. Additionally, the FED recently raised interest rates and looks to continue to raise them. Higher rates will make borrowing money for planting crops more expensive. Higher interest rate on farm loans stand to cause US farmers to also plant fewer acres next year.
Corn
The Corn market is in a weaker fundamental position than the Soybean market leading us to anticipate continued bearish sideways price action for the Corn complex. Last week the March Corn contract surrendered 10 cents (-2.67%) to finish at 364.50. The next Crop Production report and WASDE report is scheduled for release on January 12, 2016 at noon eastern. Our current market cycles for Corn point lower but we would not be surprised to see a small advance that fails and declines into February of next year.
Soybeans
The Soybean complex was under pressure last week dropping below key support. The volume was light and the week was abridged because of the Christmas holiday. Friday was closed and Thursday had an early close. The March contract has lost 19.75 cents (-2.21%) and the November contract lost 17.25 cents (-1.90%). The next potential key turn date window for the Soybean complex is January 8-12, 2016. This coincides with the Crop Production and WASDE reports due for release on January 12th. Cycle indicated that we could see Beans move sideways into the turn date window followed by an advance that pauses near January 22-25.
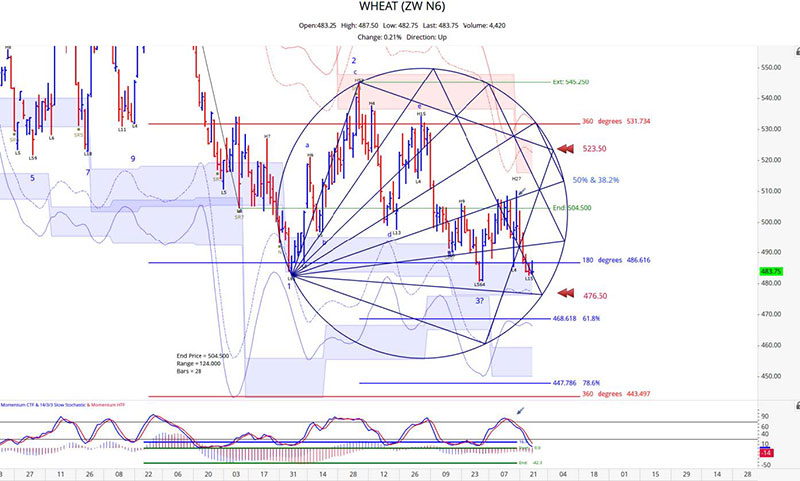
Wheat
President Macri of Argentina has put his country back on the map as a significant player as a Wheat exporter. Post the removal of its shipment taxes Argentina won its first order in three years at tender by Egypt's GASC grain authority. On Tuesday of last week, GASC, the state grain importer for the world's top wheat-buying country bought 120,000 tonnes of supplies from Argentina. Argentina has held its positions as the 2nd ranked Wheat exporter in the southern hemisphere but had seen it volumes dropping in record numbers over the past 3-4 years because of the previous administration’s policies that were not export friendly.
July Wheat lost 16.25 cents (-3.26%) last week ending the week at 482.76.
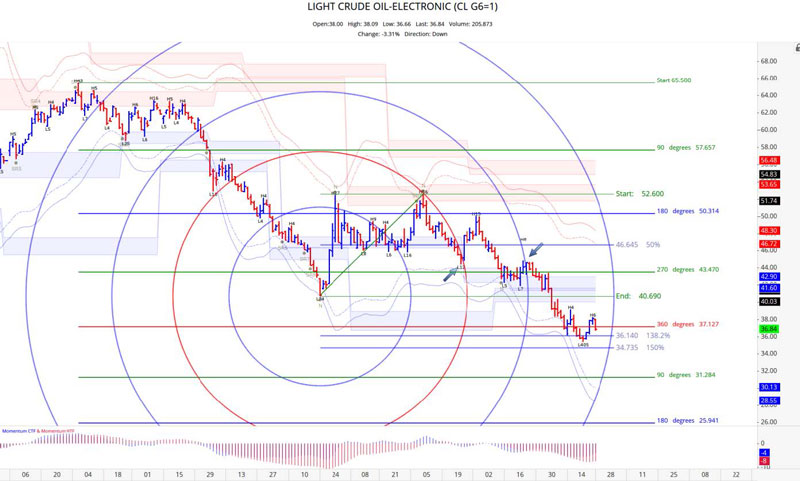
Crude Oil
The February Crude Oil contract made low on December 21st of 35.35 then moved up until Christmas Eve. It is under pressure today after posting a string gain of 2.04 dollars (5.66%) last week, Volume is comparatively light considering January contract just came off the board. We would still like to see a higher double bottom prior to committing to the long side.
March 2016 Corn
March Corn has breached the December 17th WASDE report low and the support side of our support/resistance bands. Our projections for continued sideways to downward movement through February continue to look good. An initial downside objective of 359 to 352 is at hand. The chart is approaching being oversold but may not pause until the January 8-12 window. We do not anticipate bullish findings from the report for Corn but it might be carried a bit by Soybean.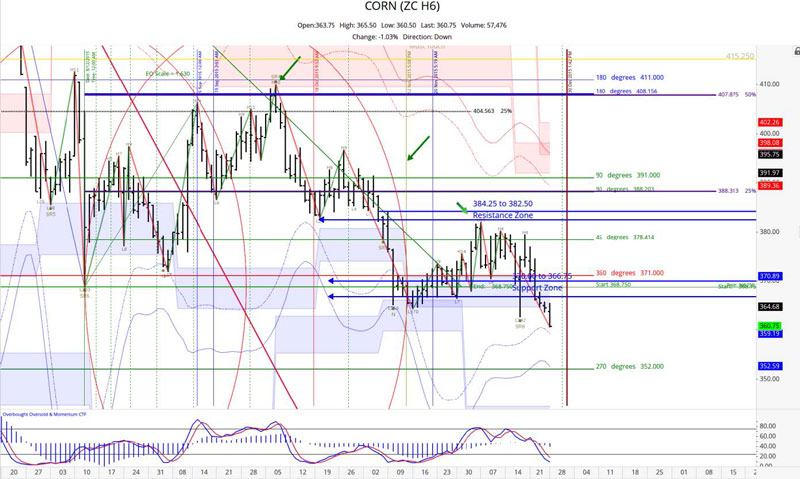
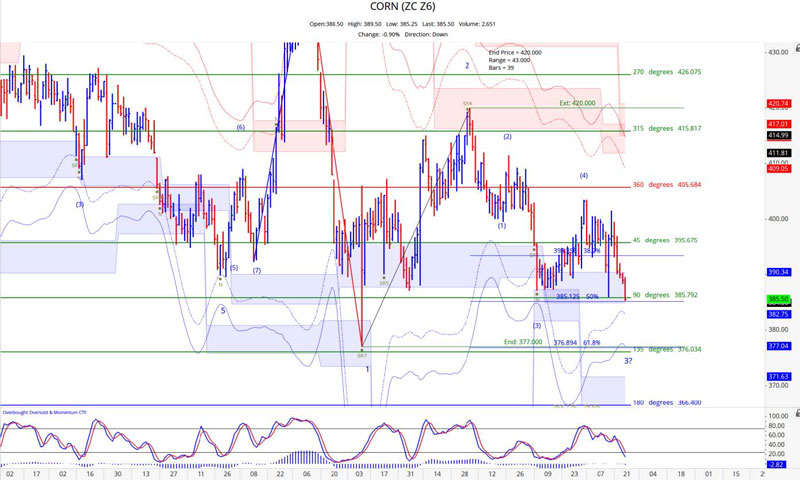
December 2016 Corn
December Corn was not able to move past the natural resistance point of 405.75 and returned to weakness as we suggested last week. It found itself back at the 90 degree level of 385.75 during the course of trading today and closing below that level would point toward prices reaching 376 at a minimum. The next consolidation zone for it rests at 382.75 to 377.00.
Grain Market Overview October 11
Read more