
Grain Market Overview August 24
August 24, 2016Grain Market Overview September 1
September 1, 2016Commodity Market News August 29

Summary
The Pro Farmer Midwest Crop Tour has come and gone. The Corn crop forecasts came in at 14.728 Billion Bushels and the Soybean forecasts were at 4.093 Billion Bushels. These numbers were slightly lower than the USDA but sill in line with the USDA expectations thereby turning any sentiment of inflated USDA numbers on its head. As would be expected the grain markets have been under pressure in our approach to the end of the month.
Surprisingly enough, for the week ending August 26rd, the CTFC weekly report showed that Money Managers raised their net-long Soybean position and lowered their net-short position in Corn. The Soybean position increased 28.17% (24,936 contracts) to 113,446 contracts. The net-short Corn was reduced by 4% (6,623 contracts) to 158,486 contracts. The widely anticipated jump in futures prices never materialized especially when the export demand from the previous week was nowhere to be found in the following week. The bets that were made ahead of the Crop Tour may have backfired. Yields are still projected to come in at record levels so price in general looks to continue to struggle going into the harvest.
The net-short Soft Red Winter Wheat position dropped to 105,999 contracts and the net-short Hard Red Winter Wheat positon fell 37.17% (9,198 contracts) to 15,548 contracts.
In South America, during the latter part of last week, the impeachment trial of the Brazilian President Dilma Rousseff started. A final vote is expected any day now from the Brazilian Congress. The "unofficial” head count shows that 49 senators will vote in favor of impeachment and 19 will vote against. There are still more than a dozen Senators undecided. Only five more are needed to remove Rousseff from office and have her replaced by Vice President Michel Temer as Brazil's new president so long as none of the 49 change their vote. The Brazilian market is of the opinion that the economic policies of Vice President Michel Temer would be better for the struggling Brazilian economy than those of President Rousseff. The currency is at its highest levels in just over a year suggesting that the removal of Rousseff is probable.
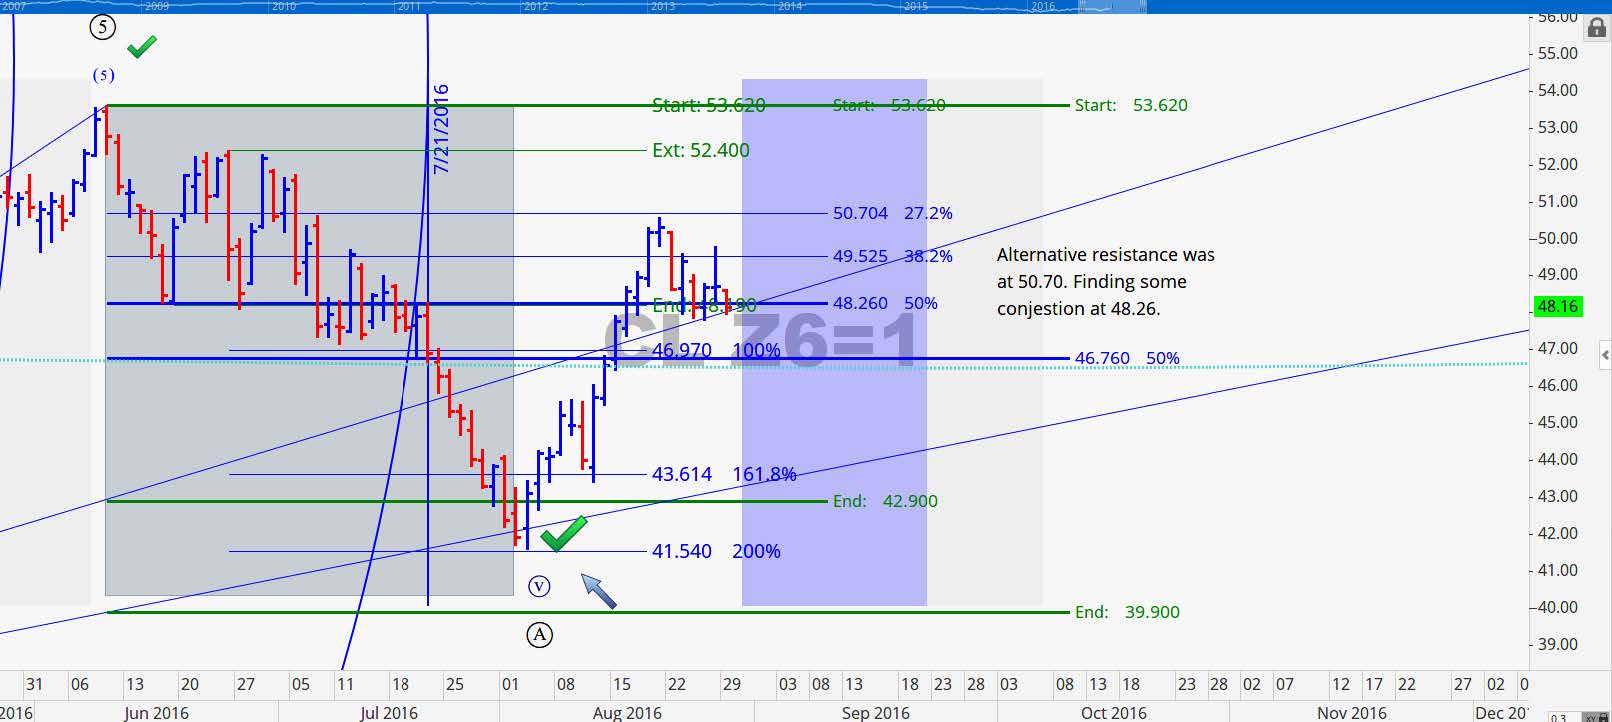
As the week closed out on Friday there were reports of a conflict between Yemen and Saudi Arabia rumored that missiles had been seen hitting a Saudi oil facility. Nothing really came of these reports but if there starts to be some traction rest assured that Crude Oil prices could be headed higher. In early trading today Crude has been softer after being up on Thursday and Friday last week. A choppy and sideways move to the downside can be expected for Crude over the next 2-3 weeks.
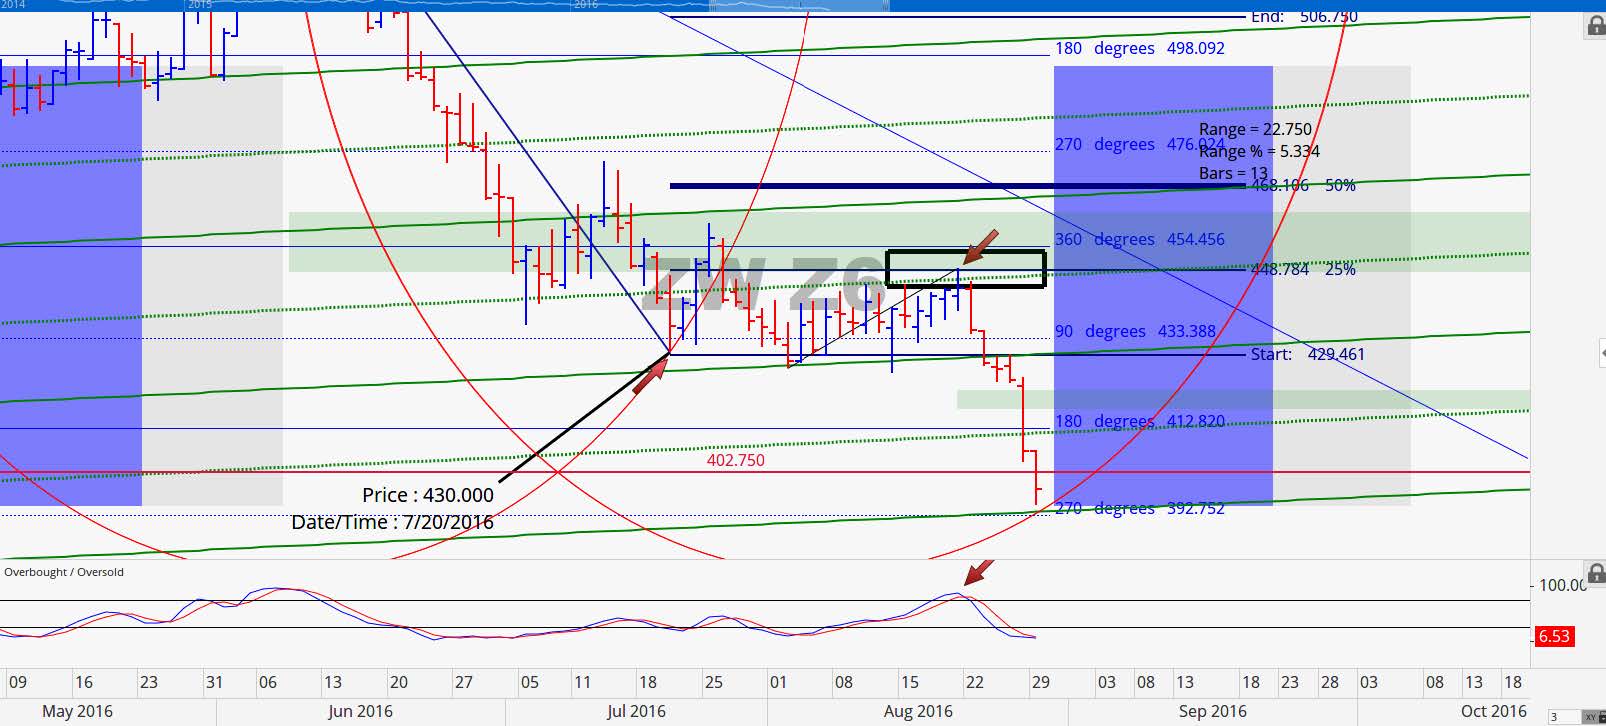
Corn
Corn futures had a rough go last week. It opened the week near the weekly high but gave up all gains finishing only a couple of ticks above the watermark low of the week. December Corn was down 18.75 cents or 5.45% and March Corn was down 19 cents or 5.37%. This big move down that we saw last week could just be powerful enough to keep prices from stabilizing till the 1st week of the month. We have been looking for some basing or consolidation to occur in September but at the same time we do not want to be naïve of the potential for some panic selling. On Friday and today the contracts breached their life of contract lows. The Crop Tour confirming the forecasted record yields may put a damper on the potential for a September advance. We continue to expect low to mild volatility over the coming week. At the end of the month look for a stronger decline into the middle of October.
December 2016 Corn Charts
Price was never able to violate resistance at 347.50. This contact moved up 5 days from the reversal low, posted an inside day then upon making a lower high and lower low on Tuesday of last week, a sell signal was confirmed and we are looking at a minimum price objective of 317.75. Price could reach as far as 311.25 and if it were to close below 311 then a test of 294 would be possible. For now we are looking at 311 as a key demarcation area. Also of note is that we are approaching a potential market timing event where we are looking for a change in trend in either the latter part of this week or early part of next. For example: if price declines as it enters the timing window then changing to an up or sideways move would be a change in trend.
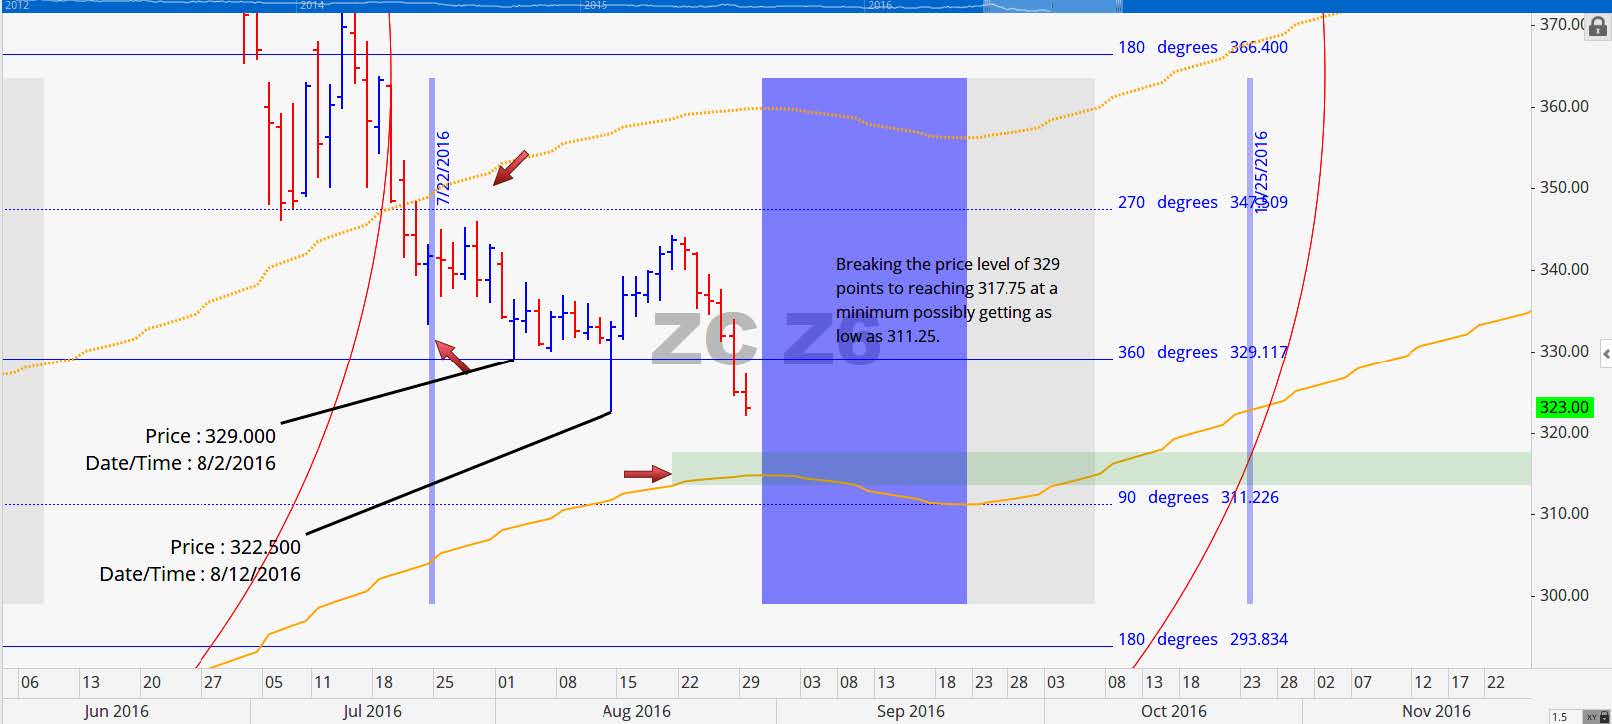
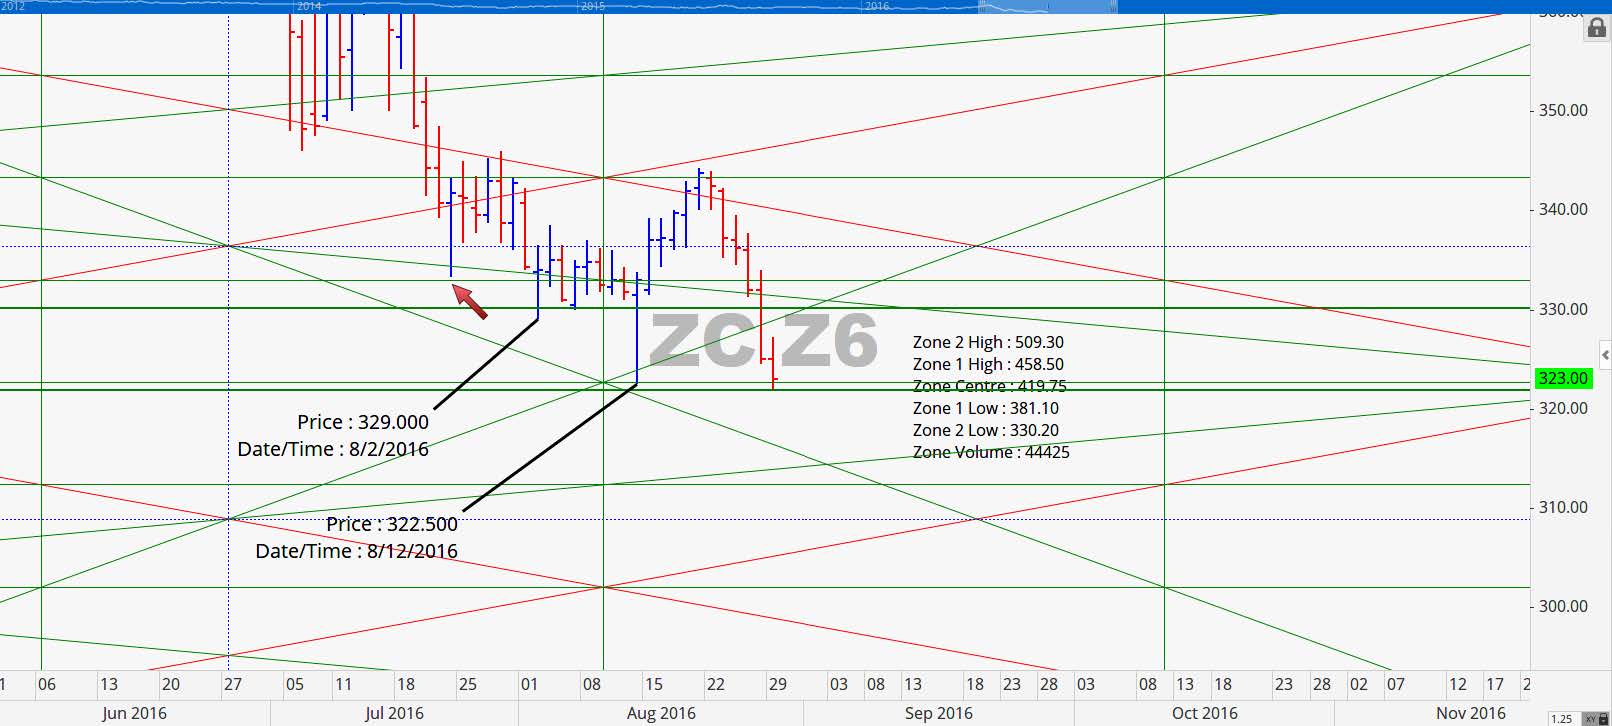
Two levels below the point of control is 330.25 and it did not put up any fight this go around. Looking that price action over the last three trading days you will see that price opened near the high of each day and closed near the low of each respective day. This is an indication of strong selling behavior and the market will need to exhaust the available sellers before it will be able to stabilize. The volume today was strong and it has been increasing over the last 4-5 trading days. Intermediate support is at 320.
March 2017 Corn Charts
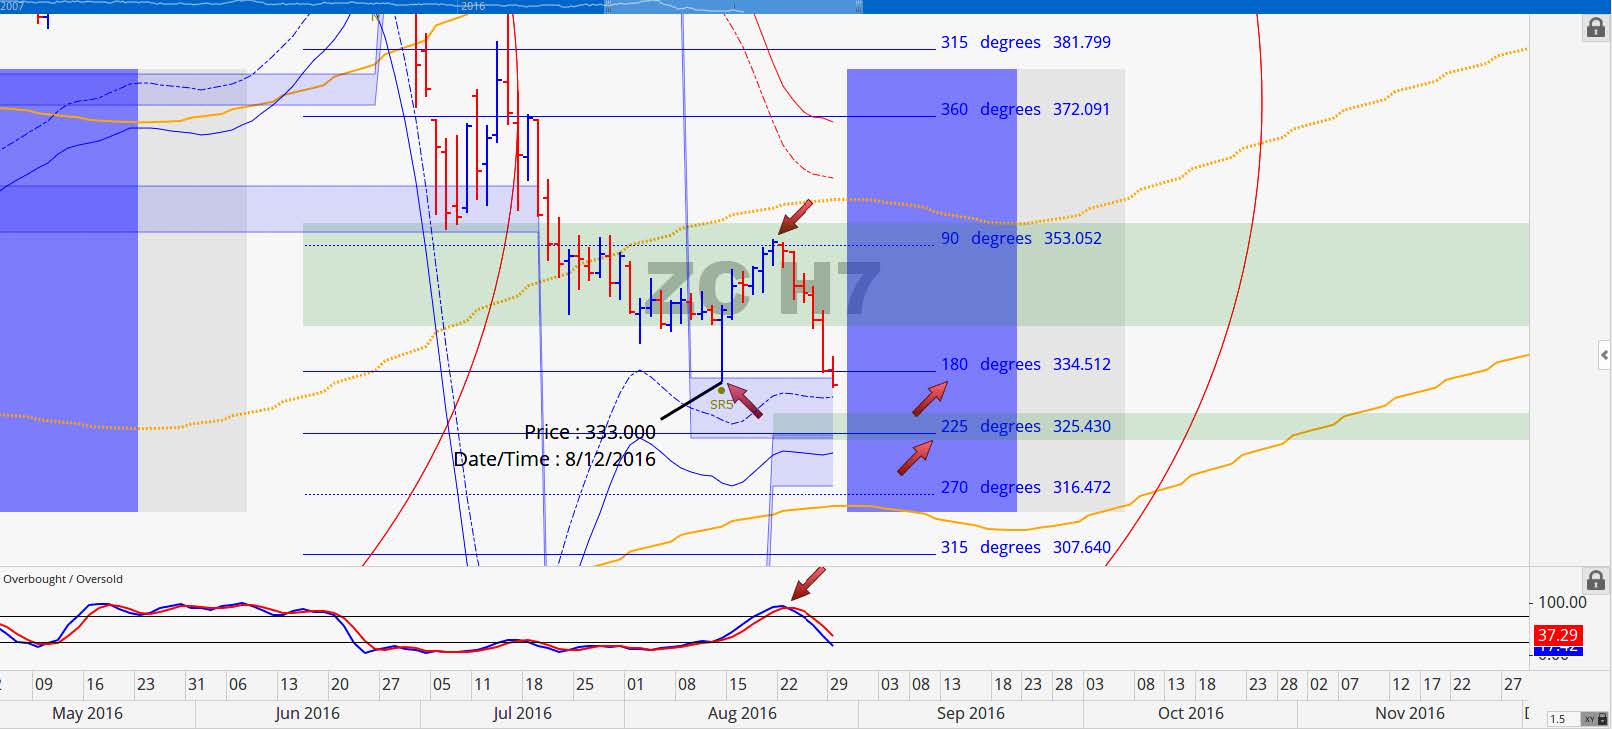
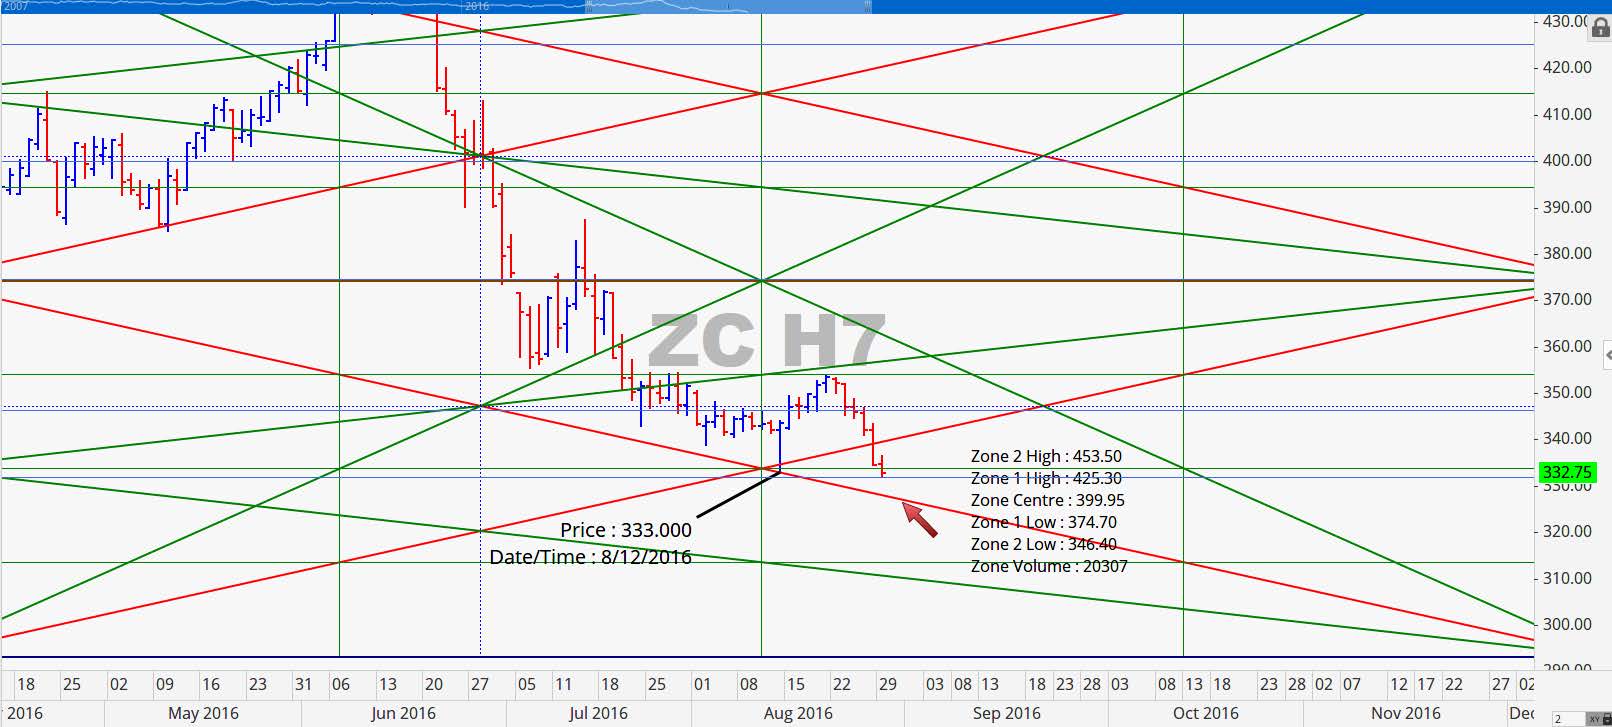
The March 2017 contract has fallen down to volatility based support. Here we have a 180 level at 334.50 that was broken today then we have levels at 325.50 then at 316.50. We believe that key support should hold at 316.50. We also have a ‘Make or Break’ region at the 325.50 zone and this contract is approaching being oversold. What we would be looking for in circumstances at these is for a capitulation sell off that confirms sellers are exhausted then look for a possible corrective bounce.
In this chart notice how price made a high right at our 354 resistance level (green horizontal line). The red diagonal line is a scaled 1x1 (price per day timing line). The 1x1 timing line is often one of the most important angles to follow. As this market is making its way down there is the possibility that price may bounce if and when it hits it again.
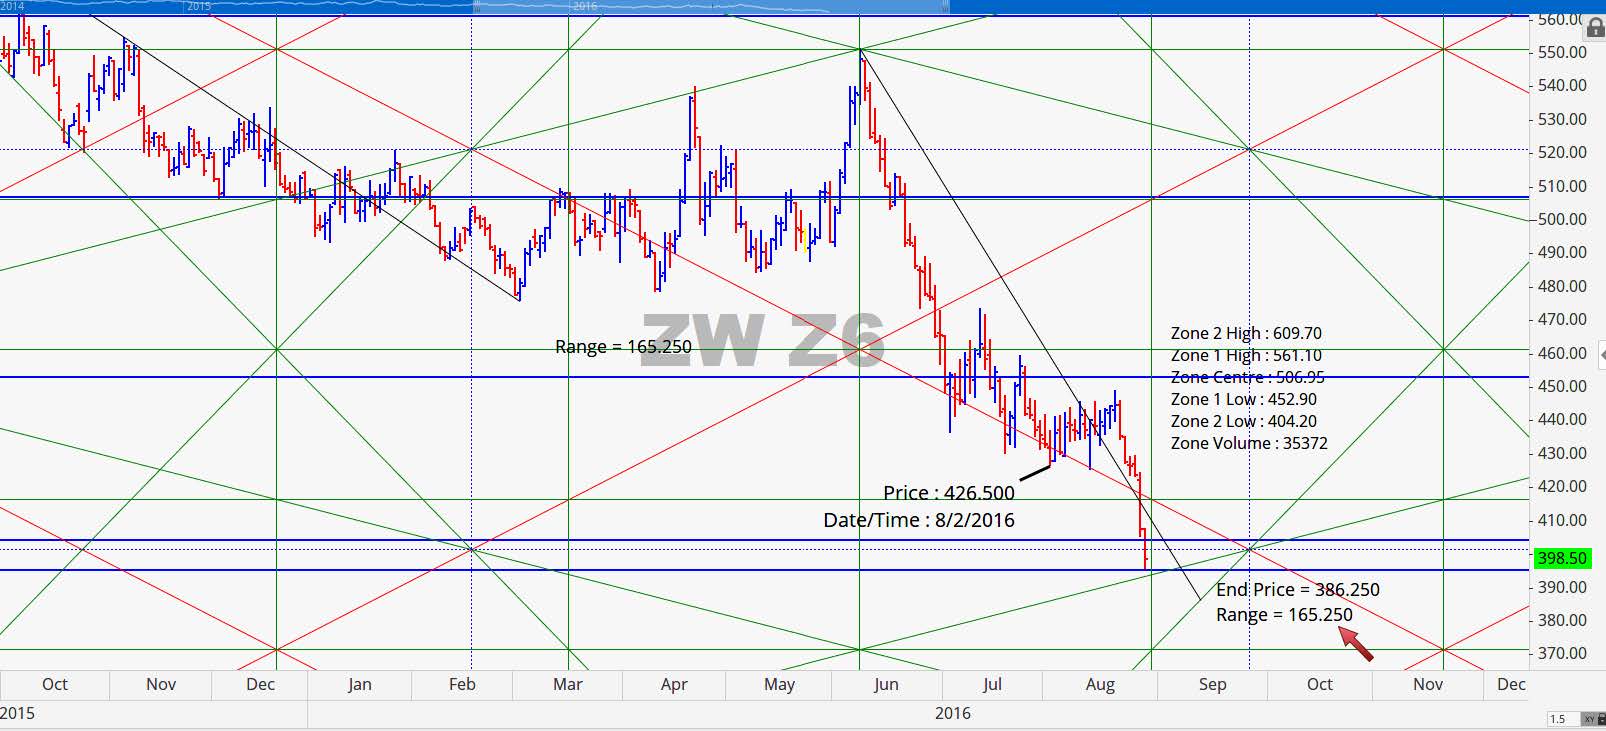
Soybeans
November Beans were down 37.25 (3.71%) and January Beans lost 35.25 (3.51%) last week. Producer and investors that were holding out in aspiration of better prices probably had their hopes dashed when the final results for the Crop Tour came in. We are looking at a yield that would break the 4 Billion Bushel mark for the first time in history. We are forecasting a decline that should run into early to mid-October and we have yet to see anything that suggests otherwise. Upon reaching potential lows in October we would not be surprised to see Beans transition into a quite low volatility period per our volatility based support and resistance metrics. The new crop sales report from last week was strong blowing away estimates but the data was not enough to halt the decline in Beans last week.
November 2016 Soybean Charts
Beans moved right up to our 90 degree resistance level of 1021.50 and that is as far as it could go. We had a number of factors come together to aid with reversing the move up. We had a number of Fibonacci time series number show up at the same time. The Fibonacci time series of number runs as follows: 1, 2, 3, 5, 8, 13, 21, 34, 55, 89, etc. In the chart below the range percentage was 8%, the # of trading days was 14 (13 plus 1) and the calendar days was 20 (21 minus 1). When several elements come together in this fashion we have what we call time and price squaring out and that made for a change in trend. Today this contract is testing 270 degrees as it approached being oversold. A target of 928 is our minimum price objective for this contract.
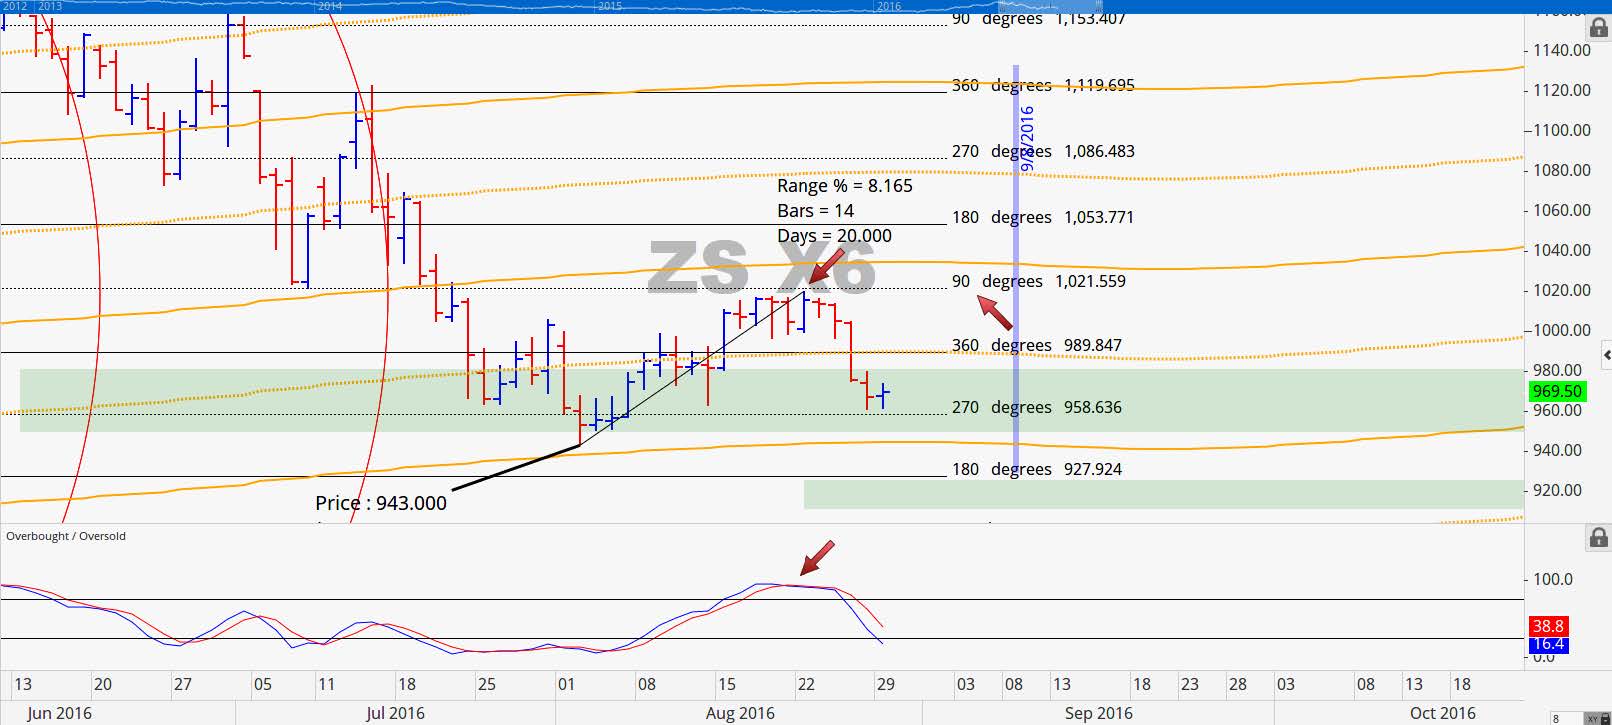
As anticipated the possible continuation pattern did not blossom and prices instead fell. The last two trading days this contract found some support at the point of control (960.50) but finishing the week below this area should send price down to 870 in the coming weeks. In fact that is a good target for this contract prior to coming off the board. Managed Money took their chances going long ahead of the tour and this Friday we will find out what their response to the findings are. Once again, once they begin to unwind it will be tough to hold prices back.
January 2017 Soybean Charts
The January Beans contract had multiple components that helped bring the corrective advance to a halt. In addition similar Fibonacci time series calculation to the November contract this contract also rolled up against volatility based resistance and a 90 degree price level. If price is able to break 955 we like a minimum price objective of 925 for this contact as far as a near term target is concerned. Between 913 and 915 we have some volatility based support forming so we want to be cautious if price gets near those levels.
Grain Market Overview October 11
Read more